HSBC Stock Gains 0.82%, Death Cross Pressure In Focus
On September 29, 2026: price 158.90 HKD, trend downtrend, RSI 44.7, support 156.90, resistance 167.60. technical analysis of hsbc stock.

At HKD 158.90, HSBC Holdings on HKEX is still trading below its SMA20 at 162.02 and SMA50 at 162.18, with a death cross already in place as the shorter average has moved under the longer one. That matters because it signals the recent recovery attempt has not yet changed the broader downward structure. The stock is also sitting near the lower half of its recent band: %B at 24% shows price is closer to the Bollinger lower band than the upper band, while the 7.4% Bollinger width points to a squeeze, a setup that often precedes a sharper move once direction is chosen. Volume was 1.2× normal, but OBV is falling, which suggests the latest trading interest has not yet translated into persistent accumulation.
Trend & Price Action
As shown in the chart, HSBC is still working through a downtrend, with the SMA20 slope at -0.52% over 5 days confirming that the short-term path remains tilted lower rather than flattening out. The price is also below the SMA20 and SMA50, which means recent rebounds have not reclaimed the trend lines that often act as a test of whether sellers are losing control. The stock’s position within the recent range is also telling: it is only 19% of the way up from support to resistance, which places it much closer to the floor at 156.90 than the ceiling at 167.60. In plain terms, the market is still treating rallies as tentative rather than decisive.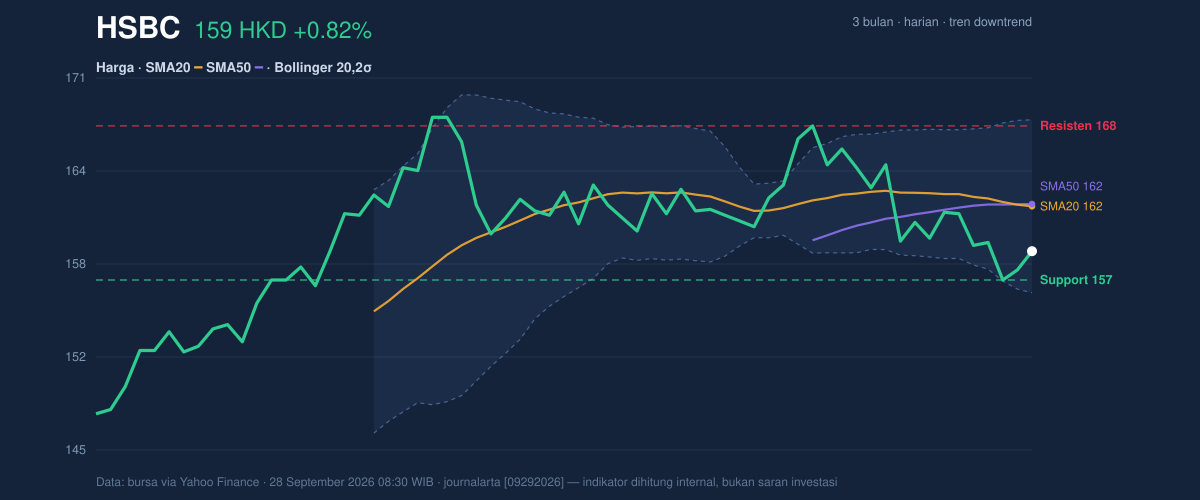
Oscillators & Momentum
Volatility & Volume
The volatility setup is important because it can amplify whichever side breaks first. The ATR at 2.78, equal to 1.7% of price, indicates volatility is moderate rather than explosive. That means the stock can move, but not in a disorderly way day to day. More interesting is the 7.4% Bollinger band width, which is relatively tight and suggests a squeeze. A squeeze does not predict direction on its own; it simply means the market has compressed, so a break above resistance or below support may travel faster once it starts. Volume adds a cautionary note. Trading volume of 12,819,424 is above the 20-day average of 10,810,740, which shows participation is there. But because OBV is declining, the volume has not been strong enough to show net buying pressure over time. That mismatch matters: higher turnover without rising OBV often means sellers are still meeting buyers on rallies. It is participation, but not yet conviction.Key Levels & Scenarios
The chart shows a clear near-term map. The first line to watch is support at 156.90. That level is important because it sits just below the current price and near the lower Bollinger band at 156.01, so a break there would expose the stock to a test of the lower part of its three-month range. On the upside, resistance at 167.60 is the key barrier, sitting below the Bollinger upper band at 168.03. A move through that zone would suggest the squeeze is resolving upward and that price is beginning to reclaim lost ground. If the stock loses 156.90, the chart would likely shift from a weak consolidation into a deeper downside phase. If it can clear 162.02 and then 162.18, that would be the first sign that the death cross is being challenged, though not yet erased. The technical message is that HSBC is boxed between a nearby floor and a heavier ceiling, with momentum still leaning negative.Technical Verdict: HOLD (wait & see)
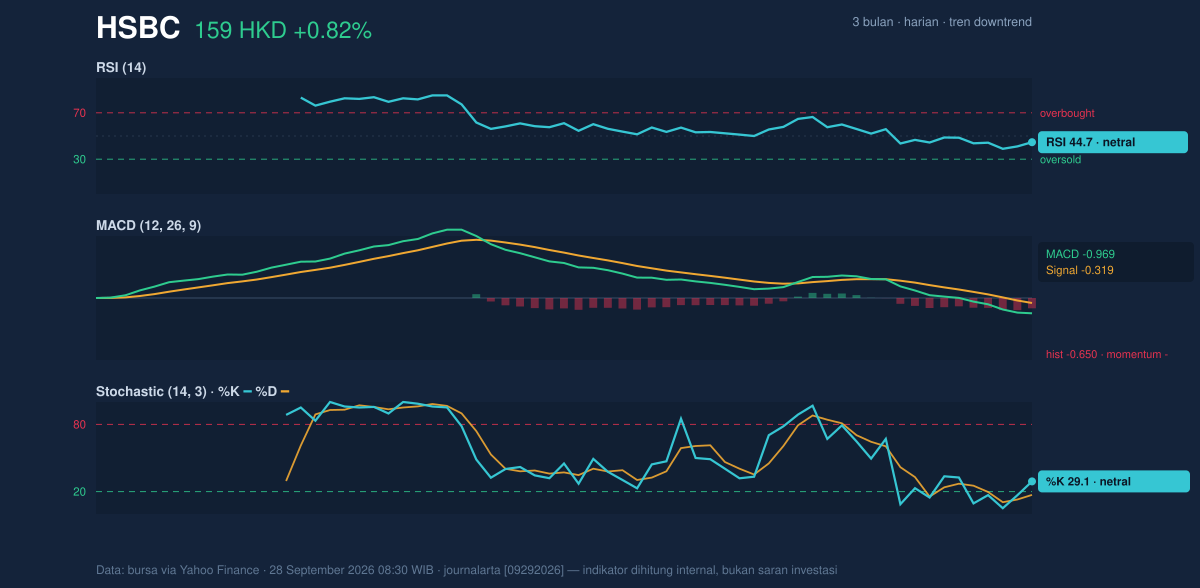
HOLD (wait & see) - MACD remains negative, with the line below the signal and a negative histogram, so downside momentum is still present. - Price is below SMA20 and SMA50, and the death cross keeps the trend structure weak. - Bollinger bands are squeezing, which raises the odds of a directional break, but not yet the direction itself. Verdict invalidated if price falls below 156.90, because that would break the nearest support and confirm renewed downside pressure. - Ideal Entry Range: 156.90 to 162.02 - Exit Target: 167.60 to 168.03 - Stop Loss Protection: below 156.01 In plain English, the chart says HSBC has not yet proved that its recent bounce is strong enough to change the trend.Summary Data HSBC
| Last price | 158.90 HKD |
| Change 1 day / 5 days / 1 month | 0.82% / -1.61% / -1.30% |
| Trend / MA-cross | downtrend / death |
| SMA20 / SMA50 | 162.02 / 162.18 |
| RSI (14) / Stochastic %K | 44.7 / 29.1 |
| Bollinger %B / ATR | 24% / 2.78 |
| Support / Resistance 20 days | 156.90 / 167.60 |
| Data as of | 28 September 2026 08:30 WIB |


