Tencent Stock Gains 0.73% Today, Momentum Gains
On September 29, 2026: price 439.80 HKD, trend sideways, RSI 50.4, support 419.00, resistance 451.60. technical analysis of tencent stock.

Tencent Holdings traded firmer on the Hong Kong exchange, with 0700.HK last at HK$439.80, up 0.73% from the previous close of HK$436.60, as the stock continued to sit between short-term recovery and a broader sideways pattern. The move matters less for its size than for its location: price is now above SMA20 at HK$435.12 but still below SMA50 at HK$449.02, a setup that usually signals a market trying to stabilise without yet proving a full trend reversal. As shown in the chart, Tencent is trading in the upper half of its recent band, but not at a decisive breakout point.
Trend & Price Action
The technical picture remains one of sideways trade, not a clean uptrend or downtrend, with the SMA20 slope at -0.41% over 5 days showing that near-term momentum is still soft even as the share price holds above that average. That matters because a rising price above a falling short average can reflect short-covering or selective buying rather than broad conviction. The stock’s 5-day gain of 2.28% has improved the tone, but the 1-month change of -2.91% says the rebound has not yet repaired the longer short-term damage.
The chart also places Tencent at 64% of the 20-hour range, with support at HK$419.00 and resistance at HK$451.60. That positioning tells us the market is leaning upward within the corridor, but still needs to clear the upper boundary before traders can speak of a stronger re-rating. The broader three-month frame adds context: the share sits well below the 3-month high of HK$497.80 and above the 3-month low of HK$415.00, which reinforces the idea that the stock is boxed in rather than in a decisive trend.
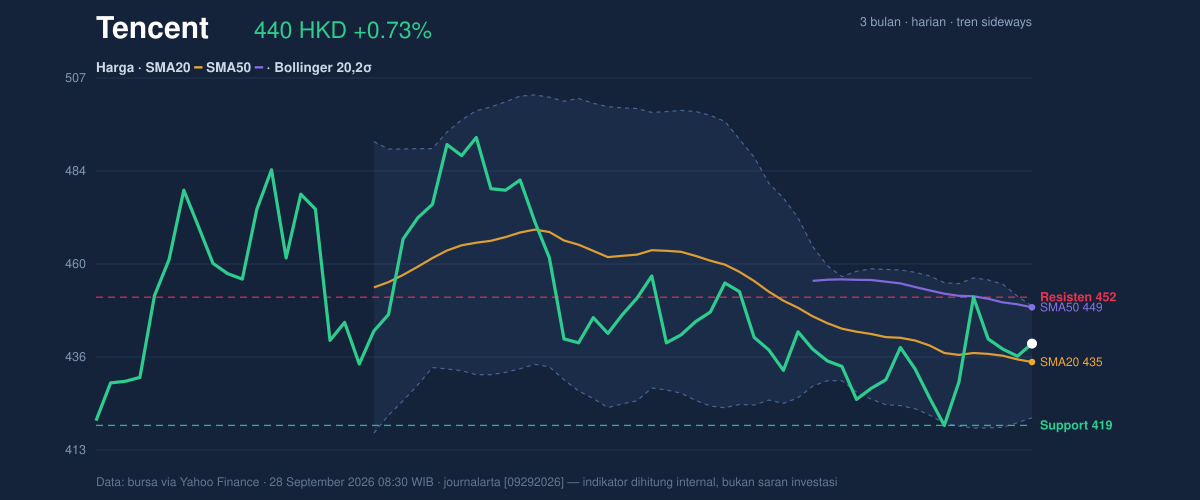
One important signal here is the lack of a new MA-cross. In plain terms, the faster and slower moving averages have not delivered a fresh bullish crossover that would normally confirm a stronger trend shift. Price is above the shorter average, but the longer average remains overhead. That is constructive, but not yet decisive.
Oscillators & Momentum
The momentum indicators are better than the headline trend suggests, but still not emphatic. RSI at 50.4 is almost perfectly neutral, which means the stock is neither stretched upward nor washed out. That is often where markets pause before choosing direction. Stochastic %K at 46.8 and %D at 43.4 also sit in neutral territory, showing no overbought warning and no oversold bounce signal. In other words, the stock is not overheated, but it has not built enough momentum to signal a clean breakout on oscillator grounds alone.
The more encouraging clue comes from MACD at -2.557 versus the signal line at -4.221, with a histogram of 1.665. Even though MACD is still below zero, the histogram being positive indicates the downside impulse is fading and the faster line is moving above the slower one. That is often how a recovery starts: not with excitement, but with the pace of decline slowing enough for buyers to regain control.
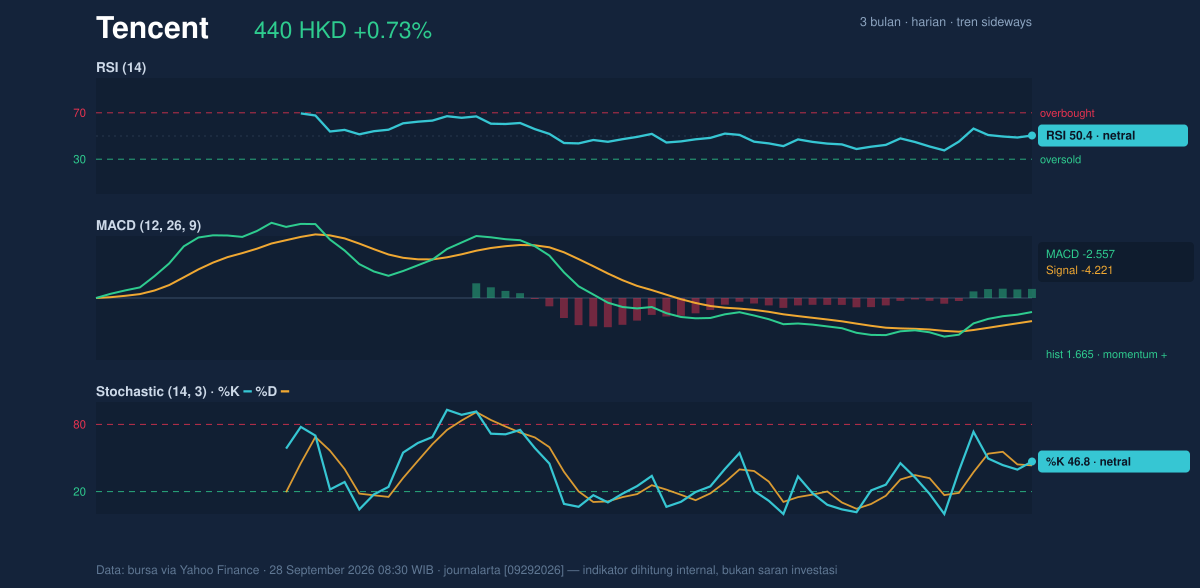
So the message from momentum is careful improvement, not confirmation. The indicators are aligned enough to support the recent bounce, but not strong enough to declare a new trend on their own.
Volatility & Volume
Bollinger Bands add an important layer to the story. Tencent is trading below the upper band at HK$449.31 but above the middle band at HK$435.12, with %B at 66%. That placement suggests price is leaning toward the upper side of its recent volatility envelope without yet pressing into the extreme zone. More importantly, the 6.5% band width is described as narrowing, a classic squeeze condition that often precedes a sharper move. A squeeze does not predict direction; it warns that the market is compressing energy and may soon release it.
ATR at 12.27, or 2.8% of price, says volatility is moderate rather than wild. That makes the squeeze more meaningful: the market is not already in a high-volatility phase, so any expansion from here could be noticeable if volume confirms it.
Volume, however, is not yet fully validating the move. The latest turnover of 15,335,550 is only 0.8x normal versus the 20-hour average of 20,087,966. That means the advance is happening on lighter participation than usual. Still, OBV is rising, which is a useful counterweight: on-balance volume tracks whether money flow is accumulating over time, and its rise suggests buyers have been more persistent than the raw trading volume alone implies.
The market is nudging higher, but not with force.
Key Levels & Scenarios
The nearest technical map is straightforward. HK$435.12 is the first important pivot because it is both the SMA20 and the Bollinger middle band. Holding above that zone keeps the short-term structure constructive. Below that, HK$419.00 is the more important support floor; a break there would weaken the recovery narrative and put the stock back near the lower edge of its recent range. On the upside, HK$449.02 from the SMA50 and HK$449.31 from the upper Bollinger band sit almost on top of each other, making the HK$449-HK$451.60 zone a dense resistance cluster. If price can clear that band, it would signal that the squeeze is resolving upward and that the recent bounce is broadening.
The cleanest read is conditional: above the mid-440s, Tencent starts to look less like a rebound and more like a stock preparing to challenge the upper end of its range; below HK$419.00, the market hands control back to sellers.
Technical Verdict: HOLD (wait & see)
HOLD (wait & see)
- RSI at 50.4 and Stochastic at 46.8/43.4 are neutral, so momentum is not strong enough to confirm a breakout.
- MACD histogram at 1.665 is positive, which is constructive, but MACD remains below zero, so the trend is not fully repaired.
- Bollinger bands are squeezing and price is above SMA20 at HK$435.12, but still below SMA50 at HK$449.02, leaving the stock in a decision zone.
- Verdict invalidated if price falls below HK$419.00, which would break the key 20-hour support.
- Ideal entry range: HK$435.12 to HK$439.80
- Exit target: HK$449.02 to HK$451.60
- Stop loss protection: below HK$419.00
For non-traders: Tencent looks steadier than it did a few sessions ago, but it has not yet proved that the rebound is strong enough to leave the sideways range behind.
“We’re still waiting for the market to show its hand.”
Summary Data Tencent
| Last price | 439.80 HKD |
| Change 1 day / 5 days / 1 month | 0.73% / 2.28% / -2.91% |
| Trend / MA-cross | sideways / none |
| SMA20 / SMA50 | 435.12 / 449.02 |
| RSI (14) / Stochastic %K | 50.4 / 46.8 |
| Bollinger %B / ATR | 66% / 12.27 |
| Support / Resistance 20 days | 419.00 / 451.60 |
| Data as of | 28 September 2026 08:30 WIB |


