DBS Stock Analysis: Gains 0.14%, Testing Key Resistance
On September 29, 2026: price 78.11 SGD, trend uptrend, RSI 60.9, support 76.75, resistance 78.65. technical analysis of dbs stock. DBS Stock Analysis — full…

DBS Group’s shares were trading at 78.11 SGD on SGX in early Monday dealing, just above the previous close of 78.00 and inside a narrow band that has been edging higher over the past month. The move is modest in headline terms, but the chart setup is more interesting than the day-to-day change suggests: price remains above the short-term average, volatility is compressed, and volume is still holding near normal levels. That combination often means the market is pausing rather than reversing.
Trend & Price Action
The stock is still in an uptrend, with the SMA20 at 77.52 rising at a pace of 0.47% over five days, while the SMA50 at 76.08 sits below it. That matters because price above both moving averages usually signals that recent buyers are still in control, even if conviction is not strong enough to force a decisive breakout yet. DBS is also trading near the upper half of its short-term range, with the latest reading at 72% of the 20-hour range, and just below the nearby ceiling at 78.65. The stock is not stretched to a fresh peak, but it is close enough to resistance that traders will be watching whether it can absorb supply without slipping back toward the moving average cluster.
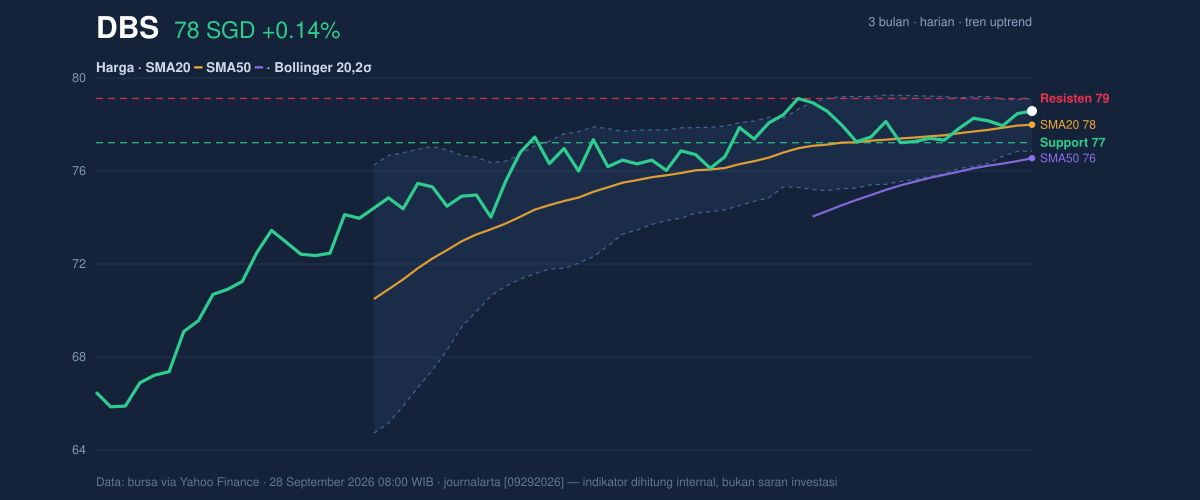
The broader frame is still constructive. DBS is only a fraction below its 3-month high of 79.05, which tells us the market has already done much of the work needed to recover from the 3-month low of 65.30. What has not yet happened is the clean follow-through that would convert that recovery into a more decisive trend extension.
Oscillators & Momentum
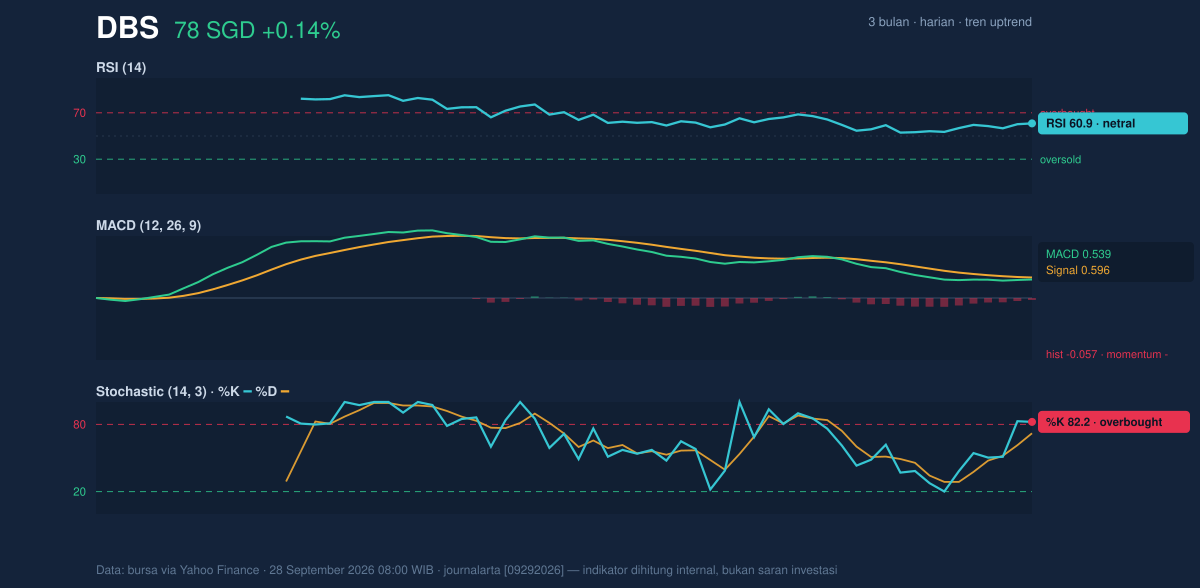
The momentum picture is more mixed than the trend picture. The RSI at 60.9 is neutral, which suggests the stock is not overheated on a medium-term basis. But the Stochastic %K at 82.2 and %D at 72.0 are in overbought territory, meaning the short-term move has already travelled far enough that fresh upside may need a pause before continuing. That does not automatically imply a reversal; it simply says the stock is running a little ahead of itself in the very near term.
The more important caution comes from MACD. The MACD at 0.539 is still positive, but it sits below the signal line at 0.596, with a histogram of -0.057. In plain language, the trend is still upward, but the pace of that advance has softened. When MACD falls below its signal line while price remains above support, it often points to consolidation rather than immediate trend failure. The market is still leaning higher, just with less force behind the push.
Volatility & Volume
Volatility is unusually calm for a stock sitting close to the top of its range. The ATR(14) at 0.91, equal to 1.2% of price, says the average daily movement is relatively small. At the same time, the Bollinger Band width of 2.9% is narrowing, a classic squeeze signal that often precedes a larger move. The key point is not that a breakout must happen, but that the market is storing energy. A squeeze near resistance can resolve sharply in either direction, depending on whether buyers can absorb offers above the upper band or whether momentum fades and the stock drifts back toward the middle band.
Volume is offering quiet confirmation rather than excitement. The latest turnover of 3,546,800 is almost exactly in line with the 20-hour average of 3,457,108, or about 1.0x normal. That means the move has not yet been driven by an obvious surge in participation, but neither does it look like a weak, unsupported drift. The OBV is rising, which is a useful sign: on-balance volume tracks whether volume is accumulating on up days more than down days, and a rising line implies underlying demand remains better than supply even without a dramatic spike in trading.
Key Levels & Scenarios
The near-term map is clear. Support at 76.75 is the first level to watch, and the SMA20 at 77.52 sits just above it as a dynamic cushion. On the upside, resistance at 78.65 is the immediate barrier, closely aligned with the upper Bollinger band at 78.66. That pairing matters because when resistance and the band top line up, the market is telling you where sellers are likely to reappear.
If DBS can clear 78.65 decisively, the chart would start to look less like a pause and more like a continuation toward the 3-month high of 79.05. If it fails there, the likely pullback zone is back toward 77.52 and then 76.75, where trend followers will want to see whether buyers defend the recent breakout base.
The signal is constructive, but not yet decisive. Price is still above the moving averages, yet momentum is cooling and the stock is pressing against resistance with only modest volume confirmation.
Technical Verdict: HOLD (wait & see)
- Why: the trend remains positive because price is above SMA20 and SMA50, and OBV is rising, which supports underlying accumulation.
- Why: Stochastic is overbought and MACD is below its signal line, showing the short-term push has lost some momentum.
- Why: Bollinger Bands are squeezing near resistance, so the next meaningful move may come only after a clearer breakout or rejection.
- Invalidation: this verdict weakens if price falls below 76.75, where short-term support and the trend structure begin to fray.
- Ideal Entry Range: 77.52 to 76.75
- Exit Target: 78.65 to 79.05
- Stop Loss Protection: below 76.75
For non-traders, that means DBS still looks steady, but the chart is asking for proof before the next move. “It’s waiting for a signal, not giving one yet.”
Summary Data DBS
| Last price | 78.11 SGD |
| Change 1 day / 5 days / 1 month | 0.14% / 0.97% / 0.92% |
| Trend / MA-cross | uptrend / none |
| SMA20 / SMA50 | 77.52 / 76.08 |
| RSI (14) / Stochastic %K | 60.9 / 82.2 |
| Bollinger %B / ATR | 76% / 0.91 |
| Support / Resistance 20 days | 76.75 / 78.65 |
| Data as of | 28 September 2026 08:00 WIB |


