DBS Testing Key Resistance: Stock Gains 0.67% (September 28, 2026)
On September 28, 2026: price 78.00 SGD, trend uptrend, RSI 59.9, support 76.75, resistance 78.65. technical analysis of dbs stock. DBS Testing Key Resistance —…

DBS Group’s shares rose to SGD 78.00 on SGX, up 0.67% from the previous close of SGD 77.48 as of 25 September 2026 08:00 WIB. The stock is still in an uptrend, sitting above both the SMA20 at SGD 77.49 and the SMA50 at SGD 75.96, but the latest signals show a market that is advancing without fully convincing momentum behind it. That matters because when a share pushes higher while momentum indicators soften, the move can continue — but it is also more vulnerable to a pause or a shallow pullback.
Trend & Price Action
The broader structure remains constructive. DBS is trading above the SMA20 and SMA50, which usually indicates that short-term and medium-term buyers are still in control. The SMA20 slope is rising at 0.54% over 5 days, reinforcing that the recent drift has been upward rather than sideways. The price is also positioned in the upper part of its recent range, at 66% of the 20-hour band, and not far from the 20-hour resistance at SGD 78.65. That proximity to resistance is important: it tells investors the market is testing an area where sellers have recently shown up.
The broader range provides context. DBS has traded between a 3-month low of SGD 65.10 and a 3-month high of SGD 79.05, so the current price is already near the top end of that envelope. The chart shows a stock that has recovered strongly, but is now approaching a ceiling rather than breaking cleanly into open space.
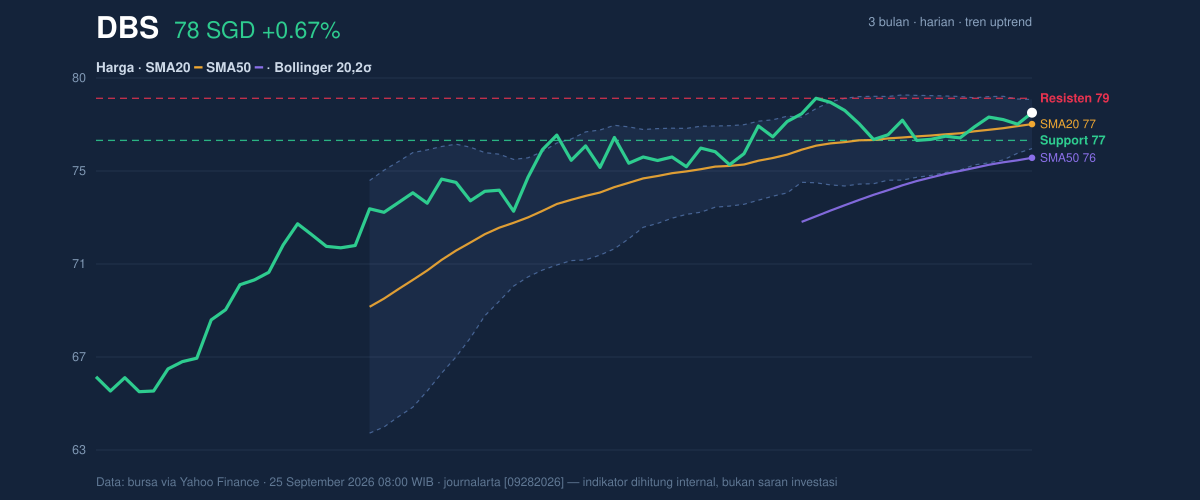
Bollinger Bands are tightening, with the band width at 2.9%, which often signals a squeeze: price compression that can precede a sharper move. The current price sits at %B 73%, meaning it is in the upper portion of the Bollinger range but not yet at the upper band of SGD 78.59. In plain language, DBS is close enough to resistance that a breakout attempt is plausible, but tight bands also warn that the next move could be abrupt in either direction.
Short line: the stock is climbing, but it is now climbing into a narrow doorway.
Oscillators & Momentum
The momentum picture is more mixed, and that is where the chart becomes more revealing. RSI at 59.9 is still neutral, which means the stock is not stretched on this measure. But the Stochastic oscillator is overbought, with %K at 82.8 above %D at 61.4. Stochastic tends to react faster than RSI, so this combination suggests the latest push has been quick enough to leave the short-term market somewhat crowded.
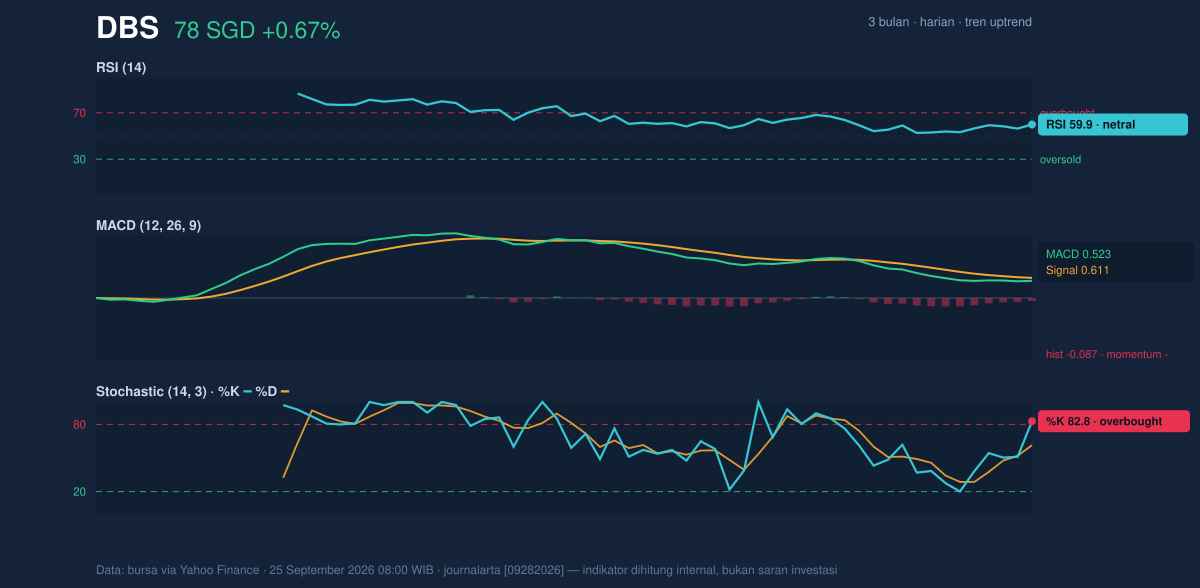
The more cautionary signal is from MACD. MACD is 0.523, below its signal line at 0.611, with a histogram of -0.087. That negative histogram means the pace of the advance is losing some traction even though the trend has not broken. In technical terms, price is still elevated, but the internal engine is not accelerating. This is the kind of setup that often produces consolidation first, and only later decides whether it will resolve higher or fade back toward support.
The message from the oscillators is clear: the trend is intact, but the momentum is no longer fully aligned with it.
Volatility & Volume
Volatility is subdued. The ATR(14) is 0.85, equal to 1.1% of price, which points to relatively low day-to-day movement. Combined with the narrow Bollinger Band width, this says the market is currently compressed rather than erratic. Low ATR can make a stock look calm, but calm is often the prelude to expansion once price leaves the compression zone.
Volume does not yet confirm a strong breakout. Last volume was 3,137,610, below the 20-day average of 3,612,408, or about 0.9x normal. That means the latest rise has not been backed by unusually heavy participation. Still, OBV is rising, which is a constructive sign because on-balance volume tracks whether accumulation is gradually improving even when the daily volume print is not dramatic. In other words, the stock is being bought over time, but not with obvious urgency.
This is why the current move feels steadier than powerful.
Key Levels & Scenarios
The immediate map is straightforward. Support sits at SGD 76.75, close to the SMA20 at SGD 77.49, while resistance is SGD 78.65, just above the current price and near the Bollinger upper band at SGD 78.59. That clustering matters because it creates a tight decision zone: price is boxed between a nearby floor and a nearby ceiling.
If DBS can push through SGD 78.65 with stronger participation, the chart would improve materially because it would clear both immediate resistance and the upper Bollinger boundary. If it fails there, the more likely path is a retreat toward SGD 76.75, where buyers have recently been willing to step in. A break below that support would weaken the short-term pattern and suggest that the squeeze is resolving downward rather than upward.
The market is waiting for proof, not hope.
Technical Verdict: HOLD (wait & see)
HOLD (wait & see)
- Reason 1: Price remains above the SMA20 and SMA50, so the broader trend is still positive.
- Reason 2: Stochastic is overbought and MACD is below its signal line, showing momentum is weakening even as price holds up.
- Reason 3: Bollinger Bands are squeezing and volume is only 0.9x normal, which points to compression without strong breakout confirmation.
- Verdict invalidated if price falls below SGD 76.75.
- Ideal Entry Range: SGD 76.75 to SGD 77.49
- Exit Target (Target Price): SGD 78.59 to SGD 78.65
- Stop Loss protection: Below SGD 76.75
For non-traders: DBS still looks healthy, but the chart says it is pausing near resistance and needs a cleaner signal before the next move becomes clearer.
“The market is waiting for proof, not hope.”
Summary Data DBS
| Last price | 78.00 SGD |
| Change 1 day / 5 days / 1 month | 0.67% / 1.48% / 2.43% |
| Trend / MA-cross | uptrend / none |
| SMA20 / SMA50 | 77.49 / 75.96 |
| RSI (14) / Stochastic %K | 59.9 / 82.8 |
| Bollinger %B / ATR | 73% / 0.85 |
| Support / Resistance 20 days | 76.75 / 78.65 |
| Data as of | 25 September 2026 08:00 WIB |

