DBS Stock Gains 0.80%, Testing Key Resistance In Focus
On Oktober 6, 2026: price 77.83 SGD, trend sideways, RSI 56.6, support 76.75, resistance 78.38. technical analysis of dbs stock. DBS Stock Gains — full details…
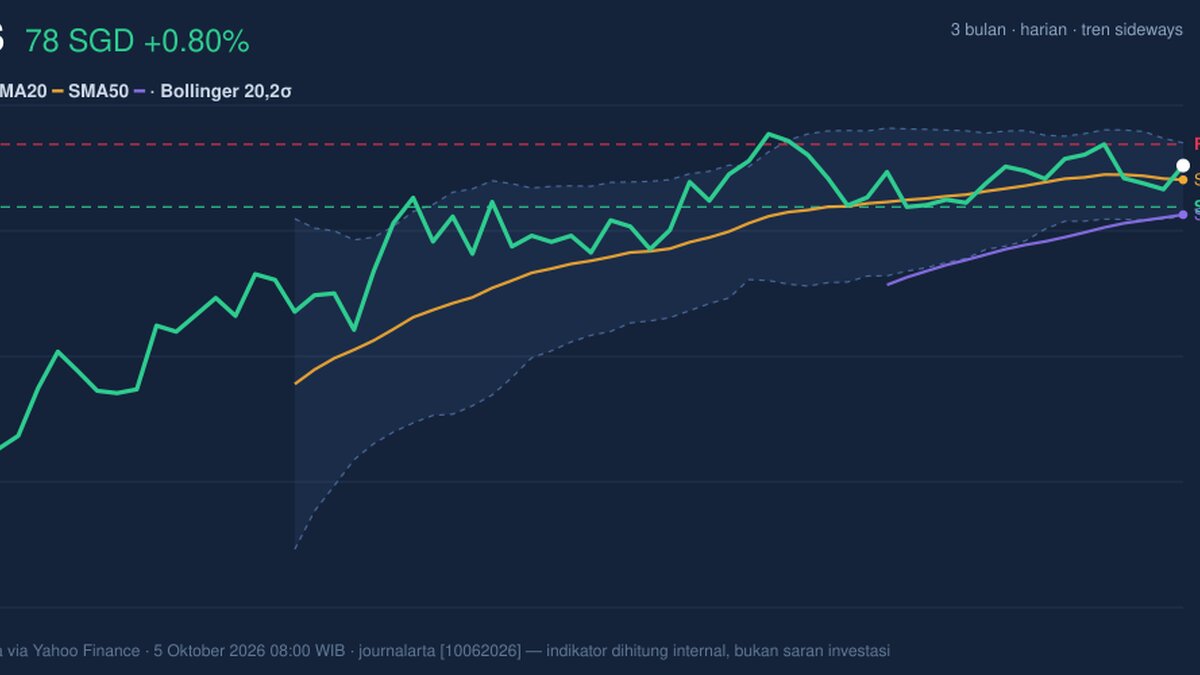
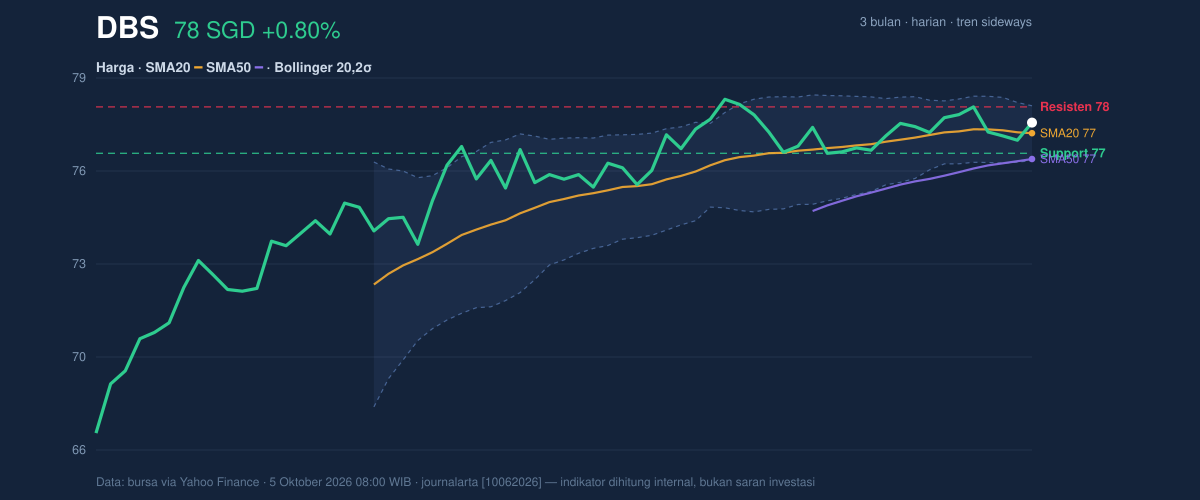
DBS Group rose 0.80% to S$77.83 on 5 October, but the gain sits within a largely sideways pattern: the stock was down 0.36% over five days and 0.82% over a month. The latest price, supplied by Yahoo Finance from exchange data, is above its short- and medium-term moving averages, yet fading trading volume and a negative MACD histogram leave the advance without strong confirmation.
Trend & Price Action
DBS is trading above its 20-day simple moving average (SMA) of S$77.46 and its 50-day SMA of S$76.55. That is a constructive price position: buyers have kept the share above levels reflecting its recent average prices. But the 20-day average is sloping down 0.08% over five days, and there has been no recent crossover between the averages. In other words, the chart does not yet show a fresh shift into a stronger trend.
The share sits about two-thirds of the way through its 20-day range, between support at S$76.75 and resistance at S$78.38. It is also below the three-month high of S$79.05, while remaining well above the three-month low of S$66.48. The broader range shows recovery from the low, but the near-term ceiling is still close.
Oscillators & Momentum
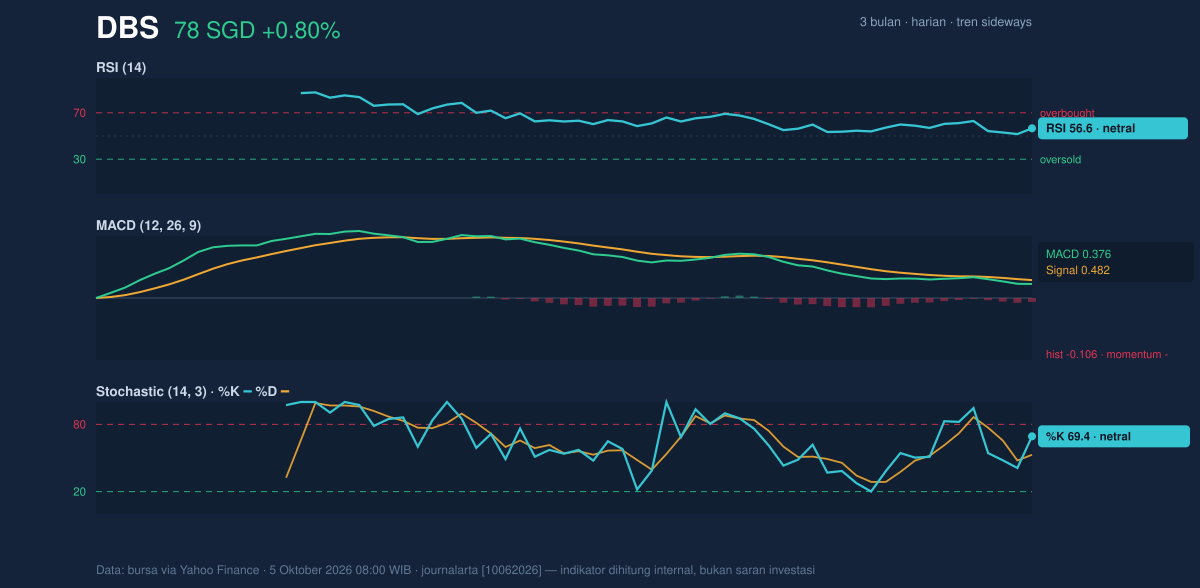
The momentum gauges are mixed rather than decisive. RSI, a measure of the speed and scale of recent price changes, is 56.6 and neutral. Stochastic %K at 69.4 and %D at 52.8 are also neutral, indicating neither an oversold rebound nor an especially stretched advance.
MACD tells a more cautious story. Its reading of 0.376 is below the signal line at 0.482, leaving the histogram at -0.106: momentum is negative despite the positive daily move. This divergence matters because a rising share price accompanied by weakening momentum can struggle to extend unless buyers return.
Volatility & Volume
The Bollinger bands—an indicator that places a range around a moving average to gauge price dispersion—are narrowing. Their width is 2.5%, with the price at 69% of the band range and nearer the upper boundary at S$78.42 than the lower boundary at S$76.49. This squeeze signals compressed volatility and the potential for a breakout, but it does not indicate which direction that move will take.
Daily volatility remains modest: ATR is S$0.86, or 1.1% of the share price. Participation, however, is lighter than usual. Volume of 3,052,670 shares was 0.8 times the 20-day average, while OBV—a running measure that relates volume to the direction of price moves—was declining. The price rise therefore lacks clear volume confirmation.
Key Levels & Scenarios
A sustained move above S$78.38 would put the near-term resistance to a test and bring the three-month high of S$79.05 into view. A failure to clear that ceiling, with MACD still negative and OBV falling, would leave the sideways structure intact. On the downside, a break below S$76.75 would weaken the immediate support picture; the lower Bollinger band at S$76.49 and the 50-day SMA at S$76.55 are nearby reference points.
Technical Verdict: HOLD (wait & see)
HOLD (wait & see) best fits the mixed signals: the price is above both moving averages, RSI and Stochastic remain neutral, but MACD momentum is negative and declining OBV does not confirm the latest rise. The narrowing Bollinger bands raise the prospect of a larger move without establishing its direction.
- Ideal entry range: S$76.75–S$77.46, bounded by 20-day support and the 20-day SMA.
- Exit target: S$78.38–S$79.05, spanning near-term resistance and the three-month high.
- Stop-loss protection: S$76.49, at the lower Bollinger band.
The verdict is invalidated if the price falls below S$76.49. In plain English, the chart has support beneath it, but buyers have yet to prove they can push through resistance.
Market data: exchange figures via Yahoo Finance, as of 5 October 2026, 08:00 WIB.
Summary Data DBS
| Last price | 77.83 SGD |
| Change 1 day / 5 days / 1 month | 0.80% / -0.36% / -0.82% |
| Trend / MA-cross | sideways / none |
| SMA20 / SMA50 | 77.46 / 76.55 |
| RSI (14) / Stochastic %K | 56.6 / 69.4 |
| Bollinger %B / ATR | 69% / 0.86 |
| Support / Resistance 20 days | 76.75 / 78.38 |
| Data as of | 5 Oktober 2026 08:00 WIB |
Track DBS share price daily: live levels, support/resistance and our full DBS analysis history.