Singtel Stock Technicals Today: Gains 0.47%, Testing Support Level
On Oktober 6, 2026: price 4.27 SGD, trend downtrend, RSI 37.6, support 4.25, resistance 4.56. technical analysis of singtel stock. Singtel Stock Technicals —…
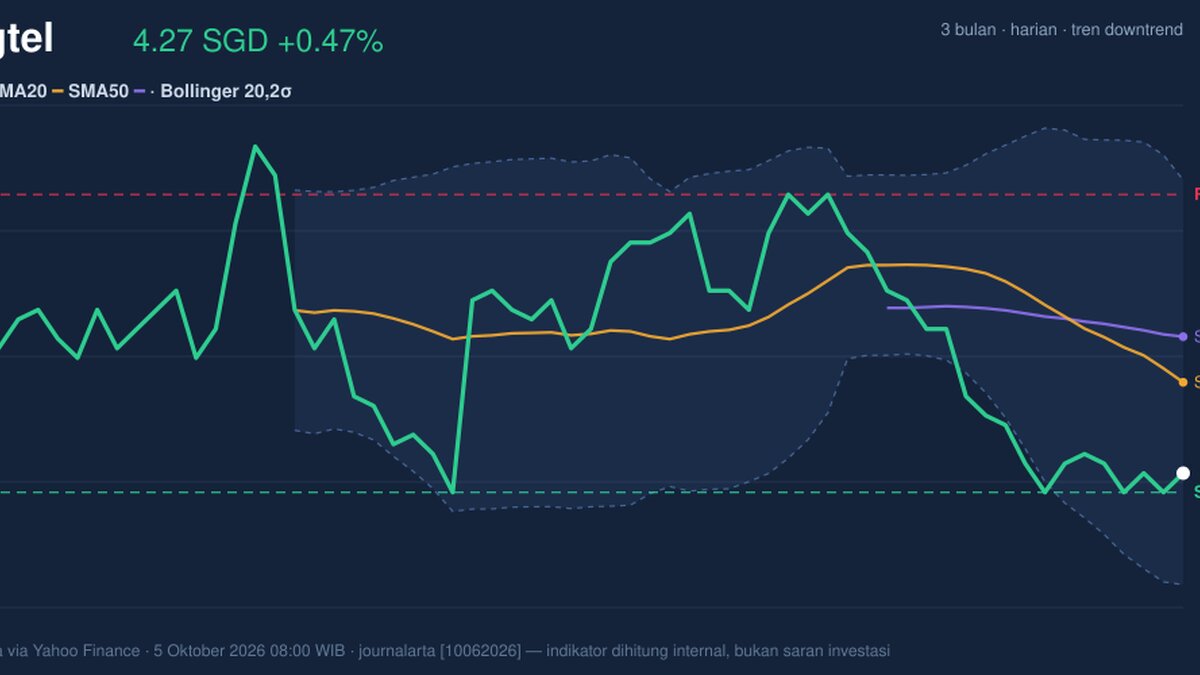
Singtel shares rose 0.47% to SGD 4.27 on the Singapore Exchange, but the modest daily gain has yet to reverse a weakening short-term trend: the stock is down 6.36% over one month and remains below both its 20-day and 50-day moving averages. The latest price data are from the exchange via Yahoo Finance, as of 5 October 2026 at 08:00 WIB.
Trend & Price Action
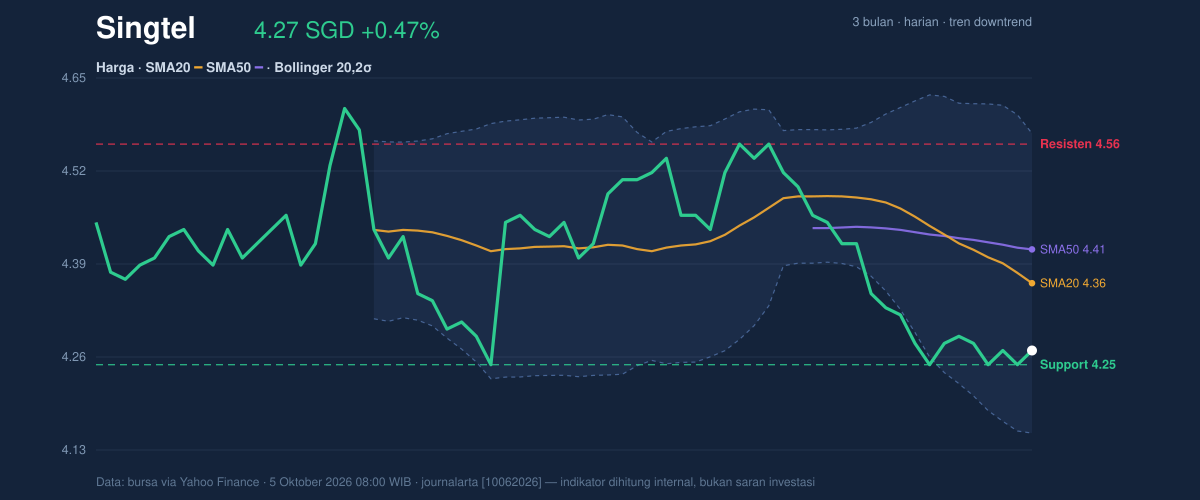
The price sits below the 20-day average of SGD 4.36 and the 50-day average of SGD 4.41, a structure consistent with near-term pressure rather than a confirmed recovery. The 20-day average is falling at 1.27% over five days, while no new moving-average crossover has formed. That means the recent uptick is still a counter-move within a declining trend, not yet evidence that the trend has changed.
Singtel is close to the lower end of its 20-day trading range: the SGD 4.25 support is just below the last price, while the SGD 4.56 resistance is substantially higher. The three-month range, from SGD 4.19 to SGD 4.70, puts the latest price nearer its low than its high. As shown in the chart, the falling averages and position within the range frame the rebound as fragile unless the share price can reclaim those averages.
Oscillators & Momentum
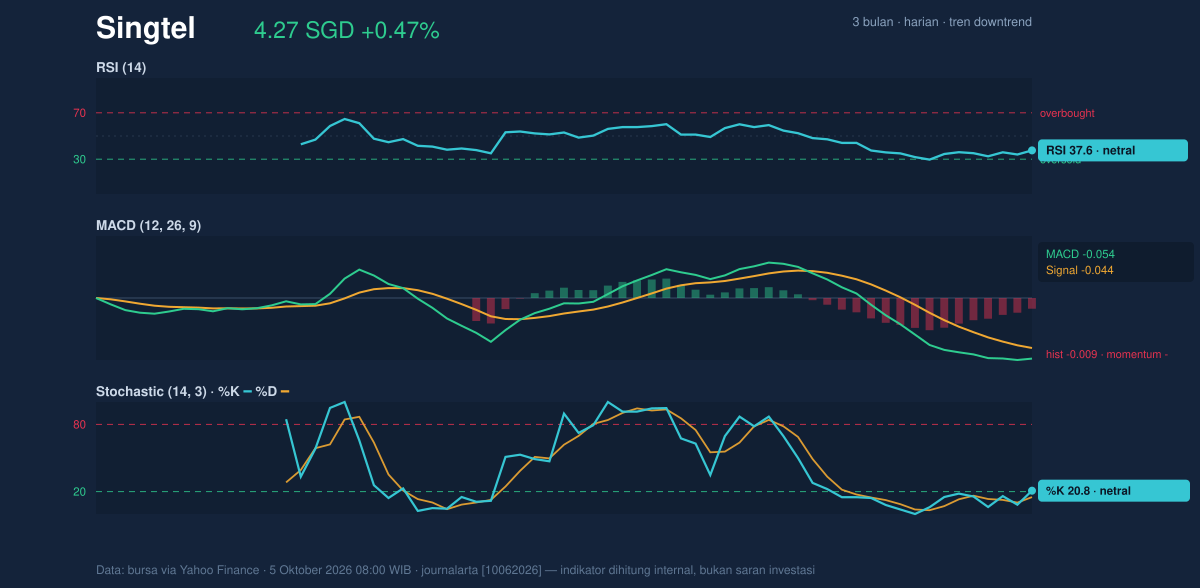
Momentum indicators broadly reinforce that cautious reading, although they do not show an extreme oversold condition. The RSI is 37.6, in neutral territory; RSI measures the pace of recent gains and losses, and this reading signals weakness without establishing that a rebound is imminent. The Stochastic is also classified as neutral, with %K at 20.8 and %D at 15.1, near the lower end of its scale but not, on the supplied signal, a confirmed reversal.
The MACD is negative at -0.054, below its -0.044 signal line, with a negative histogram of -0.009. MACD compares shorter- and longer-term price momentum; its current configuration indicates downside momentum remains in place. A shift above the signal line would be a more constructive sign, but the current data do not show one.
Volatility & Volume
The Bollinger bands place the price in the lower portion of its recent range: the %B reading is 28%, with the lower band at SGD 4.15 and the upper band at SGD 4.58. %B describes where a price sits between those bands; a low reading shows proximity to the lower band, but it does not by itself mean the stock must bounce. The band width is 9.6%, described as normal, so there is no squeeze signal suggesting volatility has compressed unusually before a sharp move.
Average true range, a measure of typical daily movement, is SGD 0.06, or 1.5% of the price, indicating low volatility in the supplied period. Participation offers little confirmation of the daily rise: volume was 13,557,500 shares, about 0.7 times the 20-day average, while on-balance volume (OBV), which tracks whether volume is heavier on rising or falling sessions, is declining. A low-volume gain against falling OBV is a weak basis for calling a durable turn.
Key Levels & Scenarios
The immediate test is whether the share price can hold SGD 4.25 support. A sustained break below it would put the three-month low of SGD 4.19 in focus; a move back above the falling averages at SGD 4.36 and SGD 4.41 would improve the price structure. Further resistance stands at SGD 4.56, near the upper Bollinger band, so that level combines a chart barrier with a volatility reference.
The chart makes clear why a one-day gain alone is insufficient: price remains below both averages and near the lower part of its recent range.
Technical Verdict: HOLD (wait & see)
HOLD (wait & see) best fits the mixed but still weak technical picture. The 20-day average is declining and price remains below both moving averages; MACD is negative and below its signal line; and falling OBV alongside below-average volume fails to confirm the latest gain. The neutral RSI and Stochastic, low ATR and normal Bollinger width do not provide a strong reversal signal in either direction.
- Ideal entry range: SGD 4.25–4.36, bounded by near-term support and the 20-day average.
- Exit target: SGD 4.56, the 20-day resistance and upper Bollinger band.
- Stop-loss protection: SGD 4.19, the three-month low; the verdict is invalidated if price falls below SGD 4.19.
In plain English, the chart has not yet shown enough evidence that the recent decline has ended.
| Indicator | Latest reading |
|---|---|
| Last price | SGD 4.27 |
| Daily change | +0.47% |
| Five-day / one-month change | -0.47% / -6.36% |
| SMA20 / SMA50 | SGD 4.36 / SGD 4.41 |
| RSI(14) | 37.6 |
| Stochastic %K / %D | 20.8 / 15.1 |
| MACD / signal / histogram | -0.054 / -0.044 / -0.009 |
| Bollinger bands: lower / middle / upper | SGD 4.15 / SGD 4.36 / SGD 4.58 |
| ATR(14) | SGD 0.06 |
| Volume / 20-day average | 13,557,500 / 20,383,870 |
| Support / resistance | SGD 4.25 / SGD 4.56 |
| Three-month high / low | SGD 4.70 / SGD 4.19 |
Summary Data Singtel
| Last price | 4.27 SGD |
| Change 1 day / 5 days / 1 month | 0.47% / -0.47% / -6.36% |
| Trend / MA-cross | downtrend / none |
| SMA20 / SMA50 | 4.36 / 4.41 |
| RSI (14) / Stochastic %K | 37.6 / 20.8 |
| Bollinger %B / ATR | 28% / 0.06 |
| Support / Resistance 20 days | 4.25 / 4.56 |
| Data as of | 5 Oktober 2026 08:00 WIB |
Track Singtel share price daily: live levels, support/resistance and our full Singtel analysis history.