OCBC Stock Gains 0.69%, Testing Key Resistance In Focus
On Oktober 6, 2026: price 31.88 SGD, trend sideways, RSI 55.8, support 31.00, resistance 32.22. technical analysis of ocbc stock. OCBC Stock Gains — full…
By matthew jonathan
October 5, 20263 min read
OCBC Stock Gains 0.69%, Testing Key Resistance In Focus
Exchange data cited through Yahoo Finance put OCBC at SGD 31.88 on 5 October, up 0.69% on the day but still trading in a sideways pattern. The share price sits above its 20-day and 50-day moving averages, yet weak trading volume and a negative MACD histogram temper that constructive signal: the market is holding its ground, but buyers have not clearly taken control.
Trend & Price Action
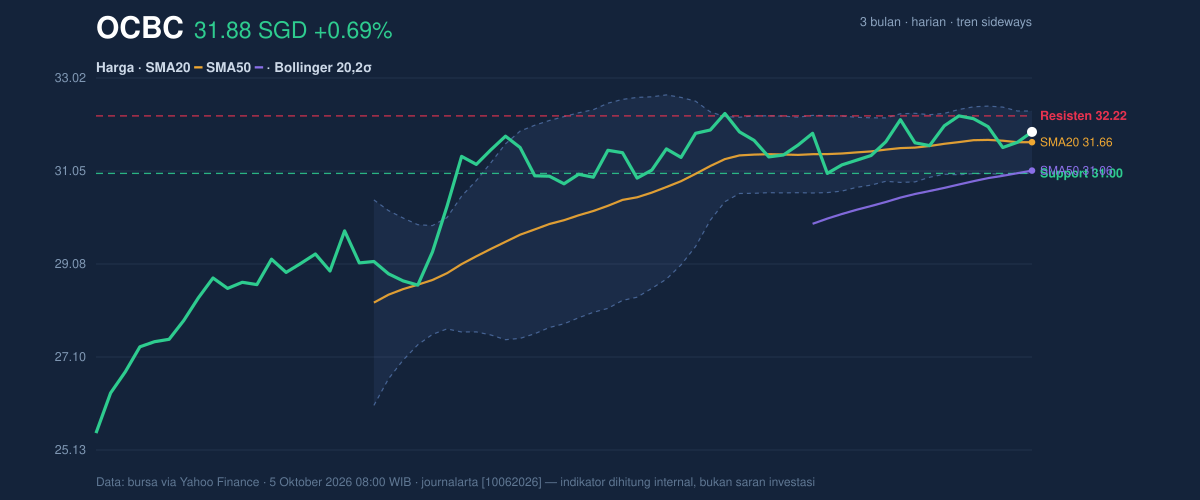
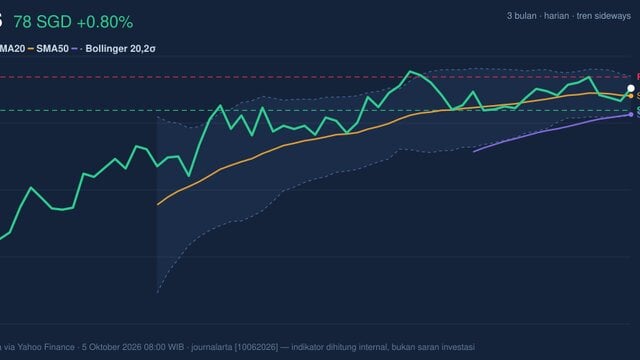
At SGD 31.88, OCBC is above its 20-day simple moving average (SMA) of SGD 31.66 and its 50-day SMA of SGD 31.06. That leaves the near-term price structure mildly positive, but the 20-day average has been flat over the past five days and there has been no fresh moving-average crossover. In other words, the price is above its trend references without a strong directional push behind it.
The shares are 72% of the way through their recent 20-day range, between support at SGD 31.00 and resistance at SGD 32.22. They remain below the three-month high of SGD 32.57, while the three-month low stands at SGD 25.28. The position near the upper part of the shorter range shows resilience, but the nearby ceiling has yet to give way.
As shown in the chart, the price is above the middle Bollinger Band, while the bands have narrowed—a squeeze that can precede a larger move but does not determine its direction.
3-month price action chart of OCBC: price, SMA20/50, Bollinger, support & resistance. Data: exchange via Yahoo Finance.
Oscillators & Momentum
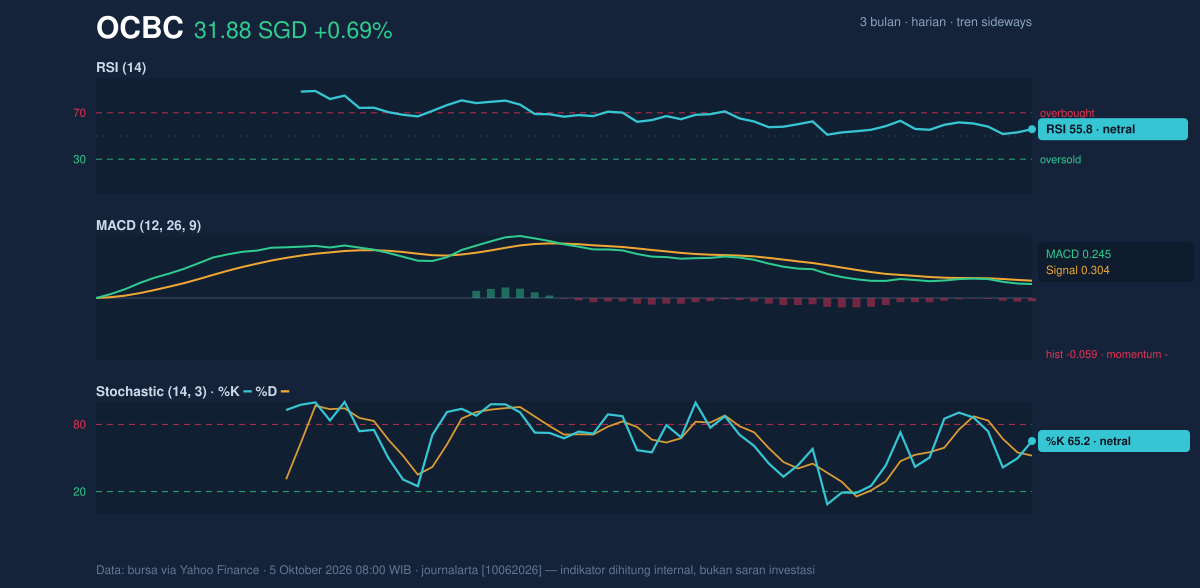
Momentum readings are mixed rather than strongly bullish or bearish. The RSI at 55.8 is neutral, indicating neither pronounced buying pressure nor an oversold condition. The Stochastic readings of 65.2 (%K) and 52.1 (%D) are also neutral; %K above %D suggests firmer short-term momentum, but the readings do not signal an extreme.
The MACD tells a more cautious story. Its value of 0.245 is below the signal line at 0.304, leaving a negative histogram of -0.059. That means the recent upward pressure implied by the price sitting above its moving averages is not yet confirmed by this momentum measure. The indicators therefore point to consolidation, not a settled advance.
Momentum chart of OCBC: RSI(14), MACD, Stochastic. Data: exchange via Yahoo Finance.
Volatility, Volume & Key Levels
The Bollinger Band range runs from SGD 31.00 to SGD 32.32, with the last price at 66% of that band. The 4.2% band width is described by the data as a squeeze, while the Average True Range (ATR) of SGD 0.44—about 1.4% of the share price—shows that recent daily movement has been relatively contained. A breakout from a quiet stretch can bring greater movement, but the direction needs confirmation from price and trading activity.
Participation is a concern for any attempted advance. Latest volume of 3,873,210 shares was about 0.6 times the 20-day average of 6,036,127, and on-balance volume (OBV) was falling. Thin activity does not prove that prices will retreat, but it weakens the evidence that buyers are accumulating shares. A sustained move above SGD 32.22 resistance would carry more weight if accompanied by stronger volume; a failure to hold SGD 31.00 support would put the lower Bollinger boundary into focus.
Technical Verdict: HOLD (wait & see)
The indicators favour patience while OCBC remains range-bound:
- The price is above the SMA20 and SMA50, but the flat SMA20 and absence of a new crossover limit the trend signal.
- RSI and Stochastic are neutral, while the MACD histogram is negative.
- The Bollinger squeeze signals the potential for a breakout, but below-average volume and falling OBV do not confirm its direction.
The verdict is invalidated if the price falls below SGD 31.00, the stated 20-day support.
- Ideal entry range: SGD 31.00–31.66, spanning support to the SMA20.
- Exit target: SGD 32.22, the stated 20-day resistance.
- Stop-loss protection: Below SGD 31.00, aligned with the support level.
For non-traders, this means the chart is balanced for now: the price is firm, but clearer confirmation is needed before the next move has direction.
Technical analysis for informational purposes only; it is not an investment recommendation.