AIA Stock Technicals Today: Drops 0.36%, RSI Oversold
On Oktober 6, 2026: price 68.95 HKD, trend downtrend, RSI 26.2, support 68.95, resistance 77.35. technical analysis of aia stock. AIA Stock Technicals — full…
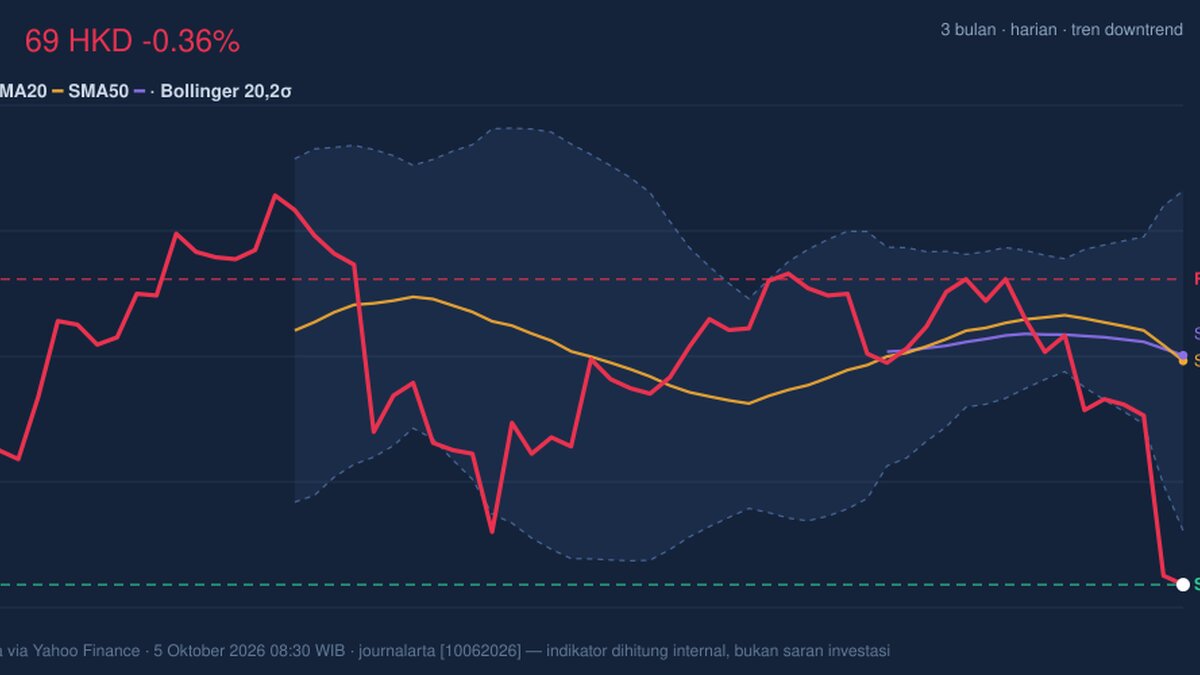
AIA Group shares fell 0.36% to HK$68.95 on 5 October, extending a five-day decline of 6.51% and a one-month loss of 11.03%. The insurer’s price sits at the bottom of its recent trading range, while several momentum measures are deeply oversold. That combination points to sustained selling pressure, but also means a short-term rebound is possible without confirming that the downtrend has ended.
Trend & Price Action
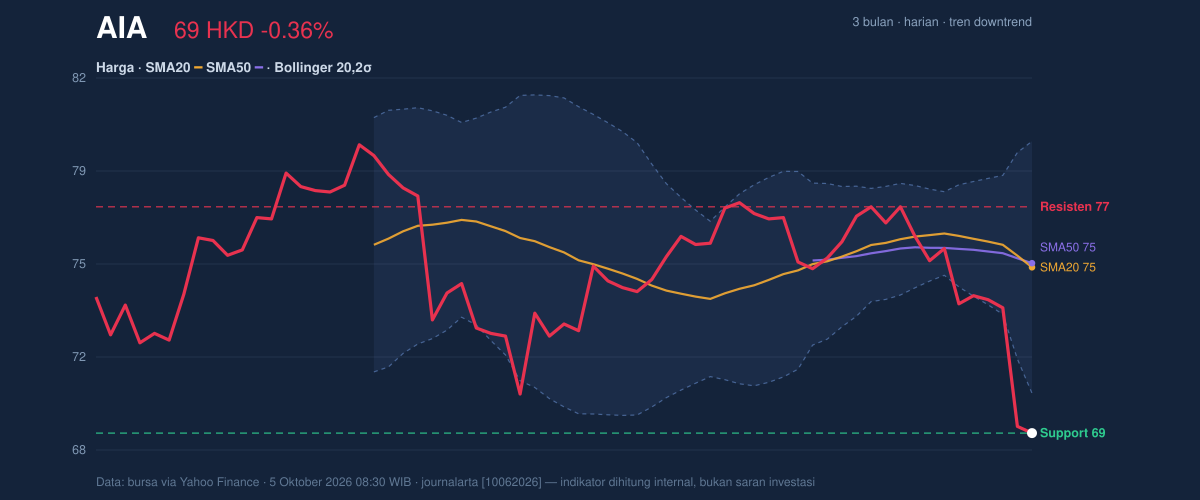
The shares are below both the 20-day simple moving average (SMA), at HK$75.10, and the 50-day SMA, at HK$75.26. The 20-day average has crossed below the 50-day average, a death cross that signals weakening near-term price structure rather than a standalone forecast. The 20-day SMA’s downward slope—1.53% over five days—reinforces that trend.
AIA is also below the lower Bollinger Band at HK$70.43. Bollinger Bands track price movement around a moving average; a close below the lower band can reflect unusually strong selling, though it does not by itself establish that losses are over. The band width is 12.5%, described in the data as normal, so there is no clear volatility squeeze to suggest that a sharp move is being signalled by compressed trading.
As shown in the chart, the price is at the lower boundary of its 20-session range, with support at HK$68.95 and resistance at HK$77.35. The three-month low of HK$68.00 is nearby, while the three-month high is HK$80.15.
Oscillators & Momentum
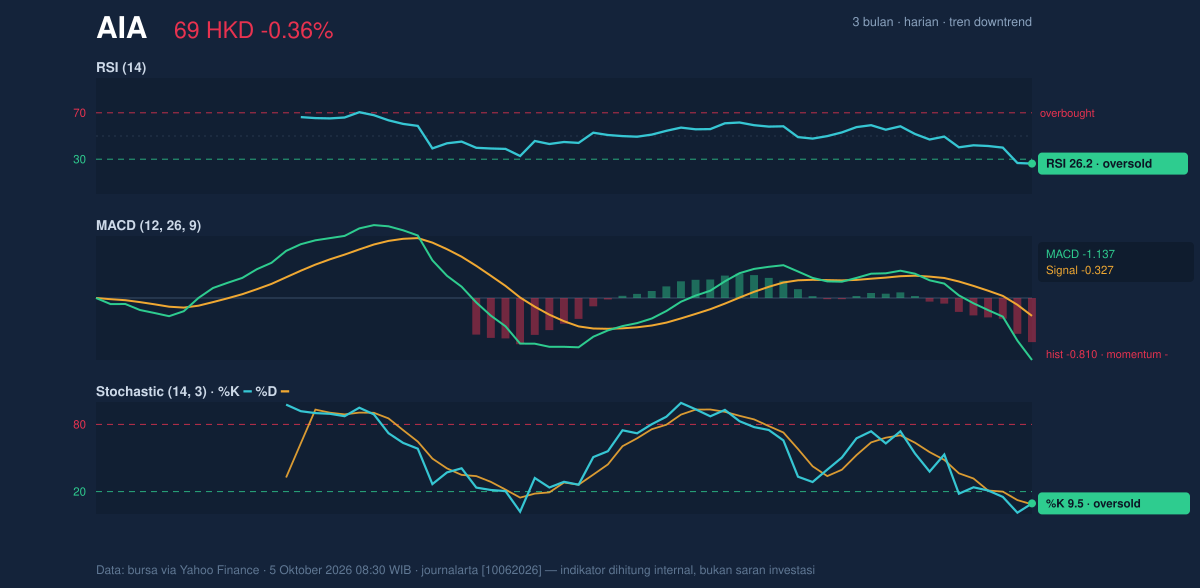
The 14-day Relative Strength Index (RSI), which measures the pace of recent gains and losses, is 26.2, in oversold territory. The Stochastic oscillator is also deeply depressed: %K is 9.5 and %D is 8.6, both oversold. These readings say that selling has been intense relative to recent trading; they do not confirm that buyers have returned.
The Moving Average Convergence Divergence (MACD), a trend-and-momentum measure, remains negative: MACD is -1.137, below its -0.327 signal line, with a -0.810 histogram. That alignment supports the bearish trend rather than showing a momentum reversal. A more persuasive shift would require improving momentum alongside a price recovery, not just an oversold reading.
Volatility & Volume
Average True Range (ATR), a measure of typical price movement, is HK$1.91, or 2.8% of the share price—moderate volatility by the supplied data. The latest volume of 35,045,345 shares was 1.3 times the 20-session average. Higher-than-usual activity during a decline suggests selling has drawn increased participation; the falling On-Balance Volume (OBV), which tracks whether volume accompanies rising or falling prices, offers no evidence of accumulation to offset that pressure.
Key Levels & Scenarios
HK$68.95 is the immediate support level, and it also marks the low end of the recent 20-session range. If the price holds there, oversold RSI and Stochastic readings leave room for a technical bounce. But a move back above the lower Bollinger Band at HK$70.43 would be an early sign of stabilisation, not proof that the wider downtrend has reversed.
If support fails, the three-month low at HK$68.00 becomes the next reference point in the supplied data. On a recovery, HK$75.10–HK$75.26 is a significant resistance zone: it contains both moving averages, while HK$77.35 marks the upper end of the recent 20-session range. Those levels frame the test AIA would need to pass to weaken the current bearish structure.
Technical Verdict: HOLD (wait & see)
HOLD (wait & see) is the technical verdict: the downtrend, death cross and negative MACD outweigh the possibility of a rebound suggested by oversold oscillators. The below-average price structure is accompanied by rising trading volume and declining OBV, adding evidence that selling pressure remains active. The verdict is invalidated if the price falls below HK$68.00, the three-month low.
- Ideal entry range: HK$68.95–HK$70.43, bounded by recent support and the lower Bollinger Band.
- Exit target: HK$75.10–HK$77.35, from the moving-average zone to recent range resistance.
- Stop-loss protection: HK$68.00, the three-month low.
In plain English, the chart remains weak, and the oversold readings have yet to show that the decline has turned.
Data
Market data: HKEX via Yahoo Finance, as of 5 October 2026, 08:30 WIB; instrument 1299.HK.
Summary Data AIA
| Last price | 68.95 HKD |
| Change 1 day / 5 days / 1 month | -0.36% / -6.51% / -11.03% |
| Trend / MA-cross | downtrend / death |
| SMA20 / SMA50 | 75.10 / 75.26 |
| RSI (14) / Stochastic %K | 26.2 / 9.5 |
| Bollinger %B / ATR | -16% / 1.91 |
| Support / Resistance 20 days | 68.95 / 77.35 |
| Data as of | 5 Oktober 2026 08:30 WIB |
Track AIA share price daily: live levels, support/resistance and our full AIA analysis history.