Alibaba Momentum Gains: Stock Drops 0.65% (September 29, 2026)
On September 29, 2026: price 107.70 HKD, trend downtrend, RSI 44.3, support 105.10, resistance 114.80. technical analysis of alibaba stock.

Alibaba Group’s Hong Kong-listed shares fell to HK$107.70 in Tuesday trade, according to Yahoo Finance data cited from the exchange feed, extending a short-term pullback that has left the stock below its 20-day average of HK$108.91 and well under the 50-day average of HK$115.06. The move matters because it shows sellers still control the near-term trend, even though momentum gauges are no longer deeply weak and the stock is trading close to the middle of its recent Bollinger band range rather than at an extreme. In plain terms: the price is drifting lower, but not in a panic.
Trend & Price Action
The broader chart setup remains downtrend, with the 20-day moving average sloping down by 1.08% over five days. That slope is important because it tells readers the short-term baseline is still falling, not flattening out. Alibaba’s shares are also trading below SMA20 and far below SMA50, which means recent price action has not yet reclaimed the levels that typically signal a more durable recovery in trend-following analysis.
The lack of a fresh moving-average cross is also telling. A “cross” usually refers to one average moving above or below another, often watched as a trend signal. Here, there is no new MA-cross, so the chart does not yet show a clean reversal. Instead, the stock is trying to stabilize inside a broader decline.
On the range structure, the shares are sitting at HK$107.70, about 27% of the way up from the 20-day support at HK$105.10 toward resistance at HK$114.80. That positioning suggests the stock is closer to the lower half of its short-term band than the top, but not at the very bottom either. The three-month range of HK$91.15 to HK$130.30 shows the current price is still in the middle of a wider recovery-and-retracement zone, rather than near a breakout high.
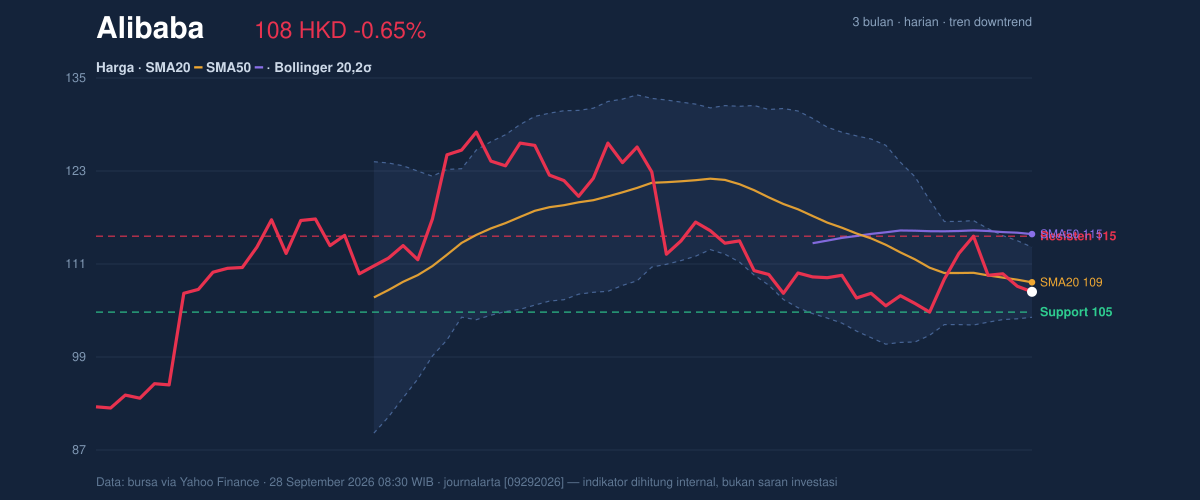
A break back above the moving averages would change the tone. For now, the chart says patience.
Oscillators & Momentum
Momentum is mixed rather than decisively bearish. The RSI at 44.3 is neutral, which means the stock is neither oversold nor overbought. That matters because RSI often helps readers judge whether a move has become stretched. At 44.3, Alibaba is weak enough to reflect selling pressure, but not weak enough to imply an exhausted selloff.
The Stochastic readings of %K 24.8 and %D 31.9 also sit in neutral territory, though close enough to the lower end to suggest the stock is leaning toward softer momentum. Stochastic compares where the price sits relative to its recent range; lower readings can hint that downside pressure is easing, but only if price starts to turn up. At present, the signal is more tentative than decisive.
The most interesting counterweight is the MACD at -1.380, still below zero, while the signal line is -1.652 and the histogram is 0.272. That combination means the trend indicator remains negative in absolute terms, but short-term momentum has improved enough to turn the histogram positive. Put simply: the downtrend is still intact, yet the pace of decline has slowed. That is often the first thing traders watch before a base forms.
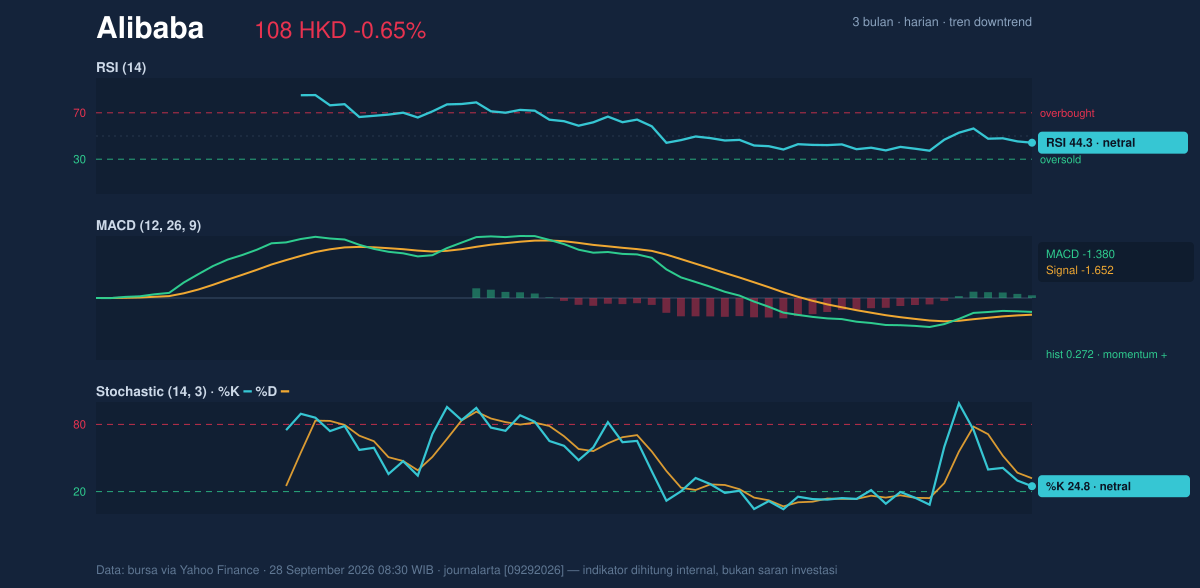
This is not a bullish breakout signal. It is a slowing of the damage.
Volatility & Volume
Bollinger Bands show the stock sitting below the middle band at HK$108.91 but above the lower band at HK$104.43, with %B at 36%. %B measures where price sits within the band structure; 36% indicates the share price is in the lower part of the range, but not pressing the floor. The 8.2% band width is described as normal, which means volatility is not compressing into a classic squeeze and also not exploding into panic. In practical terms, the chart has room to move, but no strong volatility signal is forcing a directional break yet.
ATR, or average true range, stands at HK$3.53, equal to 3.3% of price. That points to moderate day-to-day movement. For readers, this means the stock can still swing meaningfully without being unusually erratic. Volatility is present, but not extreme.
Volume adds a more constructive note. The latest turnover of 45,286,580 shares was only about 0.7x normal compared with the 20-day average of 62,480,073. Lower volume on a down day can mean the selling pressure is not being strongly confirmed by broad participation. At the same time, OBV is rising, and that is important because On-Balance Volume tracks whether volume flow is accumulating or distributing. Rising OBV while price is soft can suggest underlying buying interest is quietly building, even if it has not yet pushed the chart higher.
The result is a cautious tug-of-war: price is weak, but participation is not fully validating the weakness.
Key Levels & Scenarios
The nearest technical floor is HK$105.10 support. If that level holds, the stock could continue to trade inside the current band and attempt a move back toward the middle of the range. If it fails, the next reference point is the lower Bollinger band at HK$104.43, which would signal that downside pressure is reasserting itself.
On the upside, HK$108.91 is the first reclaim level because it is both the middle Bollinger line and the 20-day average. A close above that area would show the stock has regained its short-term balance point. Above that, HK$113.39 at the upper Bollinger band and then HK$114.80 resistance become the next tests. Those levels matter because they mark where recent sellers have previously appeared.
A move through HK$114.80 would be more meaningful than a simple bounce, because it would also start to close the gap toward SMA50 at HK$115.06. Until then, the stock is still trying to prove that the current weakness is a pause rather than a renewed leg lower.
Technical Verdict: HOLD (wait & see)
HOLD (wait & see)
- Reason 1: The trend is still down, with price below SMA20 at HK$108.91 and far below SMA50 at HK$115.06.
- Reason 2: Momentum is improving but not confirmed: MACD histogram is positive at 0.272, while RSI 44.3 and Stochastic %K 24.8 / %D 31.9 remain neutral.
- Reason 3: Volume is below average at 0.7x normal, even though OBV is rising, so accumulation is not yet strong enough to override the downtrend.
- Verdict invalidated if price breaks below HK$104.43, the lower Bollinger band, because that would signal the current support zone has failed.
- Ideal entry range: HK$105.10 to HK$108.91
- Exit target: HK$113.39 to HK$114.80
- Stop loss protection: Below HK$104.43
For non-traders: the chart is weak, but not weak enough to force a clear bearish call.
Summary Data Alibaba
| Last price | 107.70 HKD |
| Change 1 day / 5 days / 1 month | -0.65% / -4.35% / -5.69% |
| Trend / MA-cross | downtrend / none |
| SMA20 / SMA50 | 108.91 / 115.06 |
| RSI (14) / Stochastic %K | 44.3 / 24.8 |
| Bollinger %B / ATR | 36% / 3.53 |
| Support / Resistance 20 days | 105.10 / 114.80 |
| Data as of | 28 September 2026 08:30 WIB |


