Testing Support Level, AIA Stock Gains 0.41% Today
On September 29, 2026: price 74.05 HKD, trend sideways, RSI 42.1, support 73.75, resistance 77.50. technical analysis of aia stock. Testing Support Level —…

AIA Group slipped to 74.05 HKD on HKEX, up 0.41% on the day but still down 4.27% over five days and 2.89% over one month, according to exchange data via Yahoo Finance as of 28 September 2026 08:30 WIB. That combination matters more than the modest daily gain: it shows a stock that is stabilising after recent pressure, but has not yet reclaimed the moving-average band that would signal a cleaner recovery. With the price sitting just above the lower Bollinger band and below both short- and medium-term averages, the chart is telling a story of hesitation rather than renewed strength.
Trend & Price Action
The broader setup remains sideways, with the SMA20 slope at just 0.02% over 5 days, which signals a market moving almost flat rather than trending decisively. The share price is still below the SMA20 at 76.16 and also below the SMA50 at 75.75, so recent trading has not yet reversed the short-term downshift. In plain terms, that means rallies are still meeting overhead supply near the average price levels where traders tend to reassess positions.
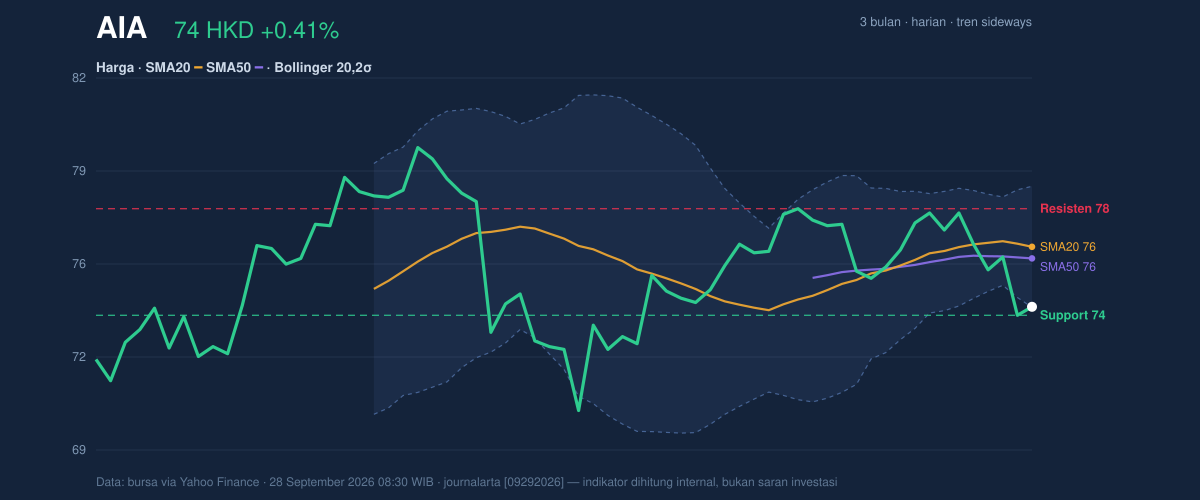
The Bollinger structure sharpens that read. The lower band is at 74.03, almost exactly where the stock closed, while the upper band sits at 78.29. A close hugging the lower edge usually signals that the market is testing downside support rather than building upward momentum. At the same time, the band width of 5.6% is narrowing, which often precedes a larger move. A squeeze does not predict direction, but it does mean the current calm can give way to a sharper break if volume and momentum align.
The stock is also trading near the bottom of its recent range. The 20-day support at 73.75 is only a fraction below the last price, while 20-day resistance at 77.50 remains overhead. With price positioned in the lower part of that band, the market is effectively leaning on support rather than pressing toward resistance. The 3-month range, from 70.10 to 80.15, shows there is still room on either side, but the current placement is closer to the lower half of that corridor.
Oscillators & Momentum
Momentum indicators are not confirming a strong rebound yet. The RSI at 42.1 is neutral, which means the stock is neither oversold nor overbought; it is simply lacking conviction. The Stochastic %K at 23.8 and %D at 31.7 sit near the lower end of their range, suggesting the price is weak but not in a classic panic zone. That combination often describes a market that is under pressure, yet still searching for a base.
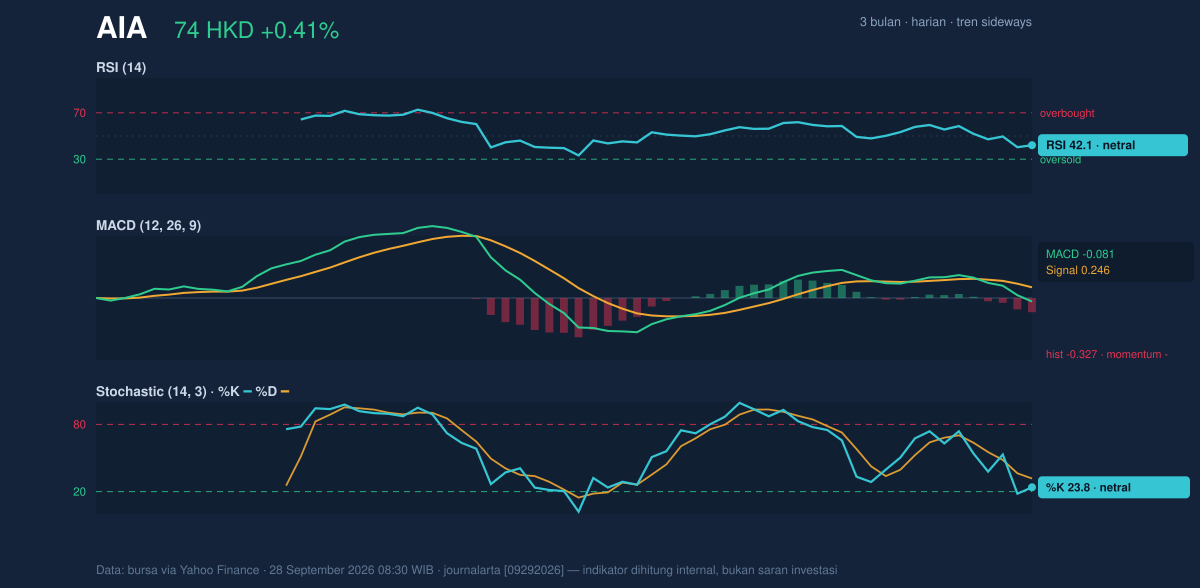
The more important signal comes from the MACD at -0.081, below its signal line at 0.246, with a histogram of -0.327. That is a negative momentum reading. In practice, it means recent price action is still running below the pace that would be needed to turn the trend higher. Even if the stock has steadied on the day, MACD says the underlying move has not yet flipped in favour of buyers.
Volatility & Volume
Volatility is moderate, not extreme. The ATR at 1.76, equal to 2.4% of price, suggests the stock can move meaningfully in a session without being disorderly. That matters because the Bollinger squeeze and ATR together imply a coiled setup: the range is tight enough to encourage a breakout, but the day-to-day movement is still large enough to make false starts possible.
Volume offers a subtle but useful counterpoint. Last traded volume was 26,843,482, roughly 1.0× normal versus the 20-day average of 25,862,433. That is not a surge, but it does show participation is holding up rather than drying out. More importantly, OBV is rising, which means cumulative volume flow has been improving even while price remains below the moving averages. In technical terms, that can hint that accumulation is quietly building before price confirms it. It is not a guarantee; it is a sign to watch.
Key Levels & Scenarios
The nearest line in the sand is 73.75, the 20-day support. If that level holds, the stock can continue to trade inside the current squeeze and potentially work back toward 75.75 and 76.16, where the SMA50 and SMA20 sit. A move through 77.50 would be more important, because it would push price into the upper half of the recent range and begin to challenge the idea that the stock is trapped below its averages.
If 73.75 gives way, the chart opens toward the lower end of the 3-month range at 70.10. That would not be a collapse, but it would signal that support has failed and that the squeeze resolved to the downside. Conversely, a sustained push above 77.50 would suggest the market has absorbed recent selling and is attempting to rebuild trend structure.
Technical Verdict: HOLD (wait & see)
HOLD (wait & see)
- RSI 42.1 is neutral, so momentum is not strong enough to confirm a durable reversal.
- MACD is negative and below its signal line, which still points to weak underlying trend energy.
- The price is below SMA20 76.16 and SMA50 75.75, while the Bollinger band is squeezing near support, so the chart is compressed but not yet resolved.
- Invalidation condition: this verdict is invalidated if price falls below 73.75, because that would break the nearest support and favor a deeper test of the lower range.
- Ideal Entry Range: 73.75 to 74.03
- Exit Target: 75.75 to 77.50
- Stop Loss protection: below 73.75
For non-traders, this means the share is sitting at a technical crossroads, where the next move matters more than the last one.
Summary Data AIA
| Last price | 74.05 HKD |
| Change 1 day / 5 days / 1 month | 0.41% / -4.27% / -2.89% |
| Trend / MA-cross | sideways / none |
| SMA20 / SMA50 | 76.16 / 75.75 |
| RSI (14) / Stochastic %K | 42.1 / 23.8 |
| Bollinger %B / ATR | 0% / 1.76 |
| Support / Resistance 20 days | 73.75 / 77.50 |
| Data as of | 28 September 2026 08:30 WIB |


