Testing Key Resistance, MRK Stock Gains 1.98% Today
On Agustus 14, 2026: price 135.55 USD, trend uptrend, RSI 68.2, support 124.40, resistance 135.55. technical analysis of mrk stock. Testing Key Resistance —…

Merck is pressing against the top of its recent trading range, with the shares closing at 135.55 USD after a 1.98% daily rise, a move that leaves the stock near its 3-month high of 135.68 and above both its short- and medium-term trend lines, according to data from Yahoo Finance via the exchange feed. For international readers, the key point is simple: the market is rewarding Merck’s recent strength, but the stock is now in a zone where momentum and exhaustion can start to compete.
Trend & Price Action
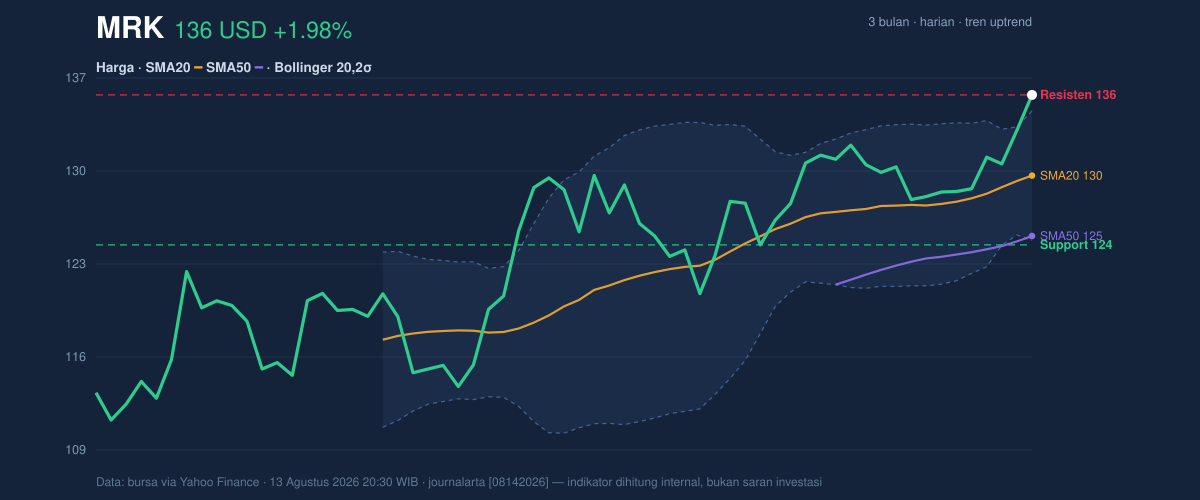
The broader structure remains constructive. Merck is in an uptrend, with the SMA20 at 129.55 rising at a 1.52%/5-day slope, while the SMA50 sits at 125.06. Price above both moving averages usually signals that recent buyers are still in control, and the gap between the two averages shows the stock has already moved beyond a simple rebound into a more established trend phase. There is no fresh MA-cross, which matters because the move is being driven less by a dramatic crossover event and more by sustained follow-through.
That kind of trend often looks healthier than a one-day spike. It also means the market has had time to build conviction.
The latest close also places Merck at 100% of its 20-day range, with support at 124.40 and resistance at 135.55. In plain terms, the stock is not just near resistance — it is sitting on it. The chart shows this clearly, with price pressing the upper edge of the Bollinger envelope and the recent high almost matching the 3-month peak. That is a sign of strength, but it also narrows the room for error.
Oscillators & Momentum
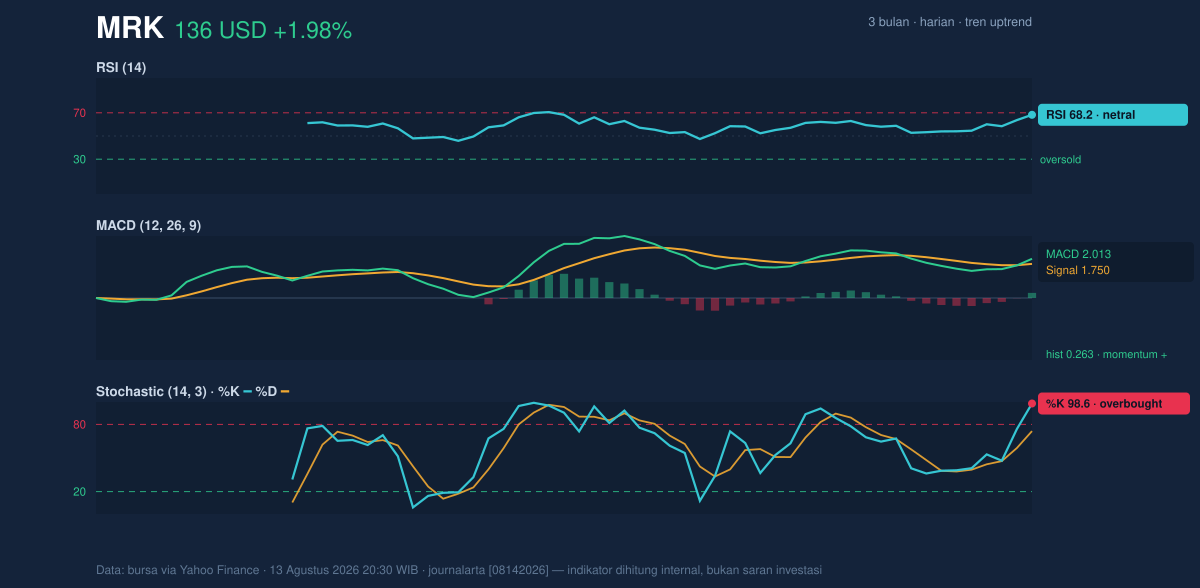
Momentum is positive, though not uniformly comfortable. The RSI at 68.2 is described as neutral in the data, but it is close enough to the classic overbought threshold to suggest the rally is mature rather than fresh. The more forceful warning comes from the Stochastic %K at 98.6 versus %D at 74.0, which is firmly overbought. Stochastic is a faster oscillator than RSI, so when it reaches extremes first, it often signals that the move is stretched even if the trend has not yet turned.
The charted momentum panel shows that the market is still pushing higher, but it is doing so with less breathing room. That is not the same as a reversal signal. It is a warning that the next leg higher may need either a pause or a decisive breakout to keep attracting new buyers.
The MACD at 2.013, above its signal line at 1.750, with a 0.263 histogram, confirms that upward momentum still has the upper hand. MACD is useful here because it measures the relationship between faster and slower price trends; a positive spread means the faster trend remains stronger. In other words, Merck has not lost momentum — it has simply reached a more crowded area of the chart.
Volatility & Volume
Volatility is moderate rather than explosive. The ATR(14) at 3.33, equal to about 2.5% of price, suggests a normal daily swing range for a large-cap stock rather than a high-stress breakout environment. But the Bollinger Bands add a more interesting signal: the band width is only 7.4%, described as a squeeze. A squeeze means volatility has compressed, and compressed volatility often precedes a larger move. The key question is direction.
At the moment, price is above the upper band, with %B at 112%. That means the stock is trading beyond the standard volatility envelope, which usually happens when price is strong enough to force a band expansion or when it is temporarily extended and vulnerable to cooling off. Because the band is still narrow, the market may be preparing for a more forceful move — but the overbought Stochastic argues that some of the immediate upside may already be priced in.
Volume supports the move, but only moderately. The latest session traded 8,893,600 shares versus a 20-day average of 8,543,315, roughly 1.0× normal. That is enough to confirm participation, not enough to suggest a panic-driven breakout. The OBV is rising, which is important because on-balance volume tracks whether volume is accumulating on up days. Rising OBV tells us the advance is being backed by net buying interest, even if the surge is not yet dramatic.
Key Levels & Scenarios
The immediate technical map is straightforward. 135.55 is both the latest close and the current resistance line, so a clean move above it would be the first sign that Merck is trying to convert resistance into support. Below that, 129.55 is the SMA20 and the Bollinger middle band, making it the first meaningful pivot if momentum cools. Farther down, 124.40 is the key support from the 20-day range, closely aligned with the lower Bollinger band at 124.73 and the SMA50 at 125.06. That cluster matters because when several support measures sit close together, they often become the market’s real line in the sand.
If price holds above 135.55, the chart suggests continuation is possible, especially if the squeeze resolves with expanding volume. If it slips back under 129.55, the move begins to look more like a stretched rally pausing for digestion. If it loses 124.40, the trend structure weakens materially because the stock would be breaking below the lower end of the recent range and the moving-average support zone.
Technical Verdict: HOLD (wait & see)
HOLD (wait & see)
- MACD is positive and still above its signal line, which supports the trend.
- Price is above SMA20 and SMA50, confirming the broader uptrend remains intact.
- Stochastic is overbought and price is already at the top of the range, so the setup is stretched.
Verdict invalidated if price breaks below 124.40, because that would damage the current range structure and put the trend support cluster under pressure.
- Ideal Entry Range: 129.55 to 124.73
- Exit Target: 135.55, with extension only if that level is reclaimed on stronger volume
- Stop Loss protection: below 124.40
In plain English: Merck still looks strong, but the stock is close enough to resistance that the next move matters more than the last one.
Summary Data MRK
| Last price | 135.55 USD |
| Change 1 day / 5 days / 1 month | 1.98% / 5.59% / 6.21% |
| Trend / MA-cross | uptrend / none |
| SMA20 / SMA50 | 129.55 / 125.06 |
| RSI (14) / Stochastic %K | 68.2 / 98.6 |
| Bollinger %B / ATR | 112% / 3.33 |
| Support / Resistance 20 days | 124.40 / 135.55 |
| Data as of | 13 Agustus 2026 20:30 WIB |



