OCBC Stock Drops 2.64%, RSI Overbought In Focus
On Agustus 19, 2026: price 30.95 SGD, trend uptrend, RSI 74.3, support 28.63, resistance 31.79. technical analysis of ocbc stock. OCBC Stock Drops — full…

OCBC Bank’s shares on SGX fell to 30.95 SGD by 17 August 2026 08:00 WIB, according to Yahoo Finance data, after closing at 31.79 SGD the previous session. The drop of -2.64% came even as the stock remained up 2.15% over five days and 8.37% over one month, a combination that usually signals a pullback inside a broader advance rather than a full trend break. In plain terms, the market is still rewarding the stock’s upward structure, but the latest move shows traders are no longer chasing it aggressively at the top of the recent range.
Trend & Price Action
The chart shows OCBC still trading in an uptrend, with the SMA20 at 29.70 SGD rising at 2.83% over five days and the SMA50 at 27.15 SGD sitting well below the current price. That spacing matters: when a shorter moving average stays above a longer one and both are rising, it usually means the market is still willing to pay higher prices for the shares. There is no new MA-cross, so this is not a fresh breakout signal; instead, it suggests the move has already been established and is now being tested.
The stock is also trading above the middle Bollinger band at 29.70 SGD, with the upper band at 31.90 SGD and the lower band at 27.50 SGD. As shown in the chart, price is sitting near the upper half of that envelope, which typically indicates strength, but also a market that may need to pause before extending further. The %B at 78% shows the price is leaning toward the top of the band rather than the center, a sign of persistent demand but also one that often comes with short-term cooling after a strong run.
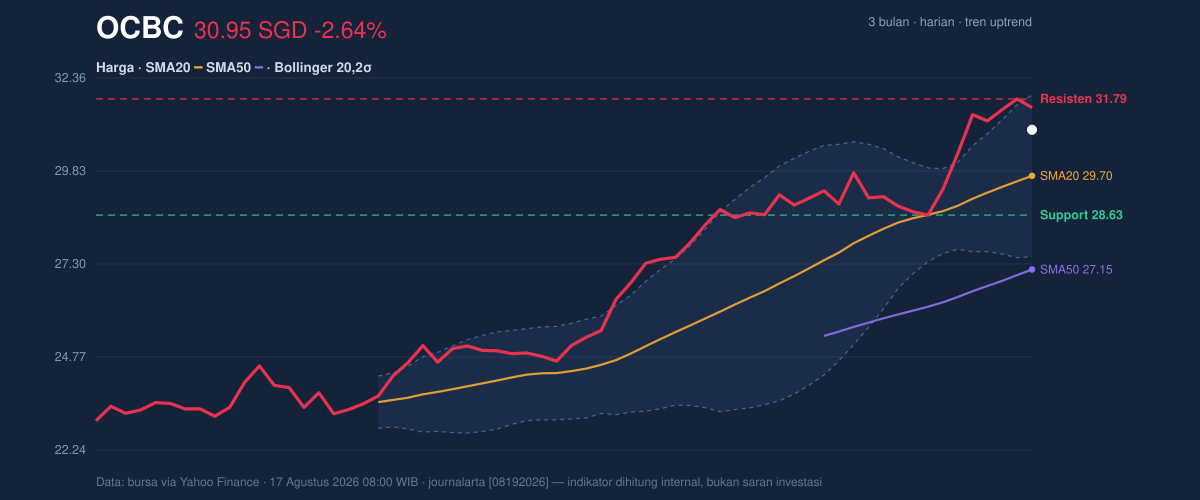
The 20-hour support at 28.63 SGD and resistance at 31.79 SGD frame the immediate battle. With the stock now at 73% of its 20-hour range, it is closer to the ceiling than the floor, which means the market has already done much of the recent upward work. The 3-month high at 31.86 SGD sits just above the latest resistance reading, so the share is effectively testing the same zone that capped the recent advance.
Oscillators & Momentum
Momentum is where the picture becomes more nuanced. The RSI(14) at 74.3 is in overbought territory, and the Stochastic %K at 90.7 versus %D at 95.5 is also stretched. These readings do not automatically mean a reversal is imminent, but they do mean the stock has advanced far enough that short-term enthusiasm may be crowded. In practical terms, overbought signals often describe speed, not direction: they tell readers the stock has been moving fast, and fast moves can continue, but they are also more vulnerable to pauses or minor pullbacks.
The MACD at 1.194, above its signal line at 1.067, with a histogram of 0.126, still points to positive momentum. That matters because MACD is not just about whether a stock is expensive in the short term; it also shows whether trend strength is still expanding. Here, the indicator says the trend has not rolled over yet. As shown in the chart, the oscillator stack is therefore mixed rather than bearish: RSI and Stochastic are warning of stretch, while MACD says the underlying trend remains constructive.
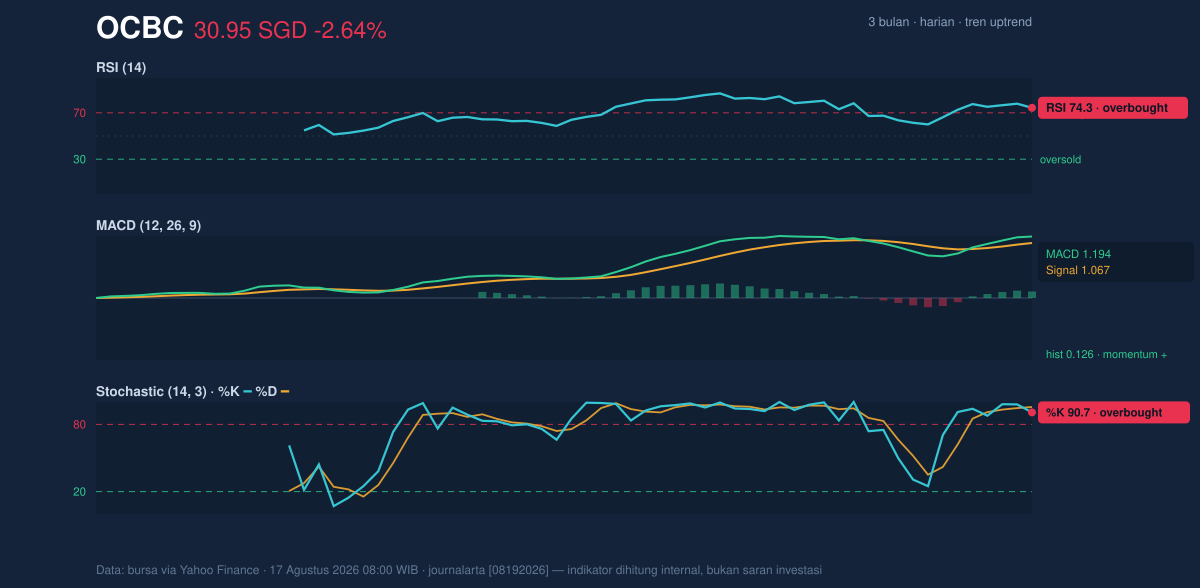
That split is important. When momentum tools disagree like this, markets often enter a digestion phase rather than an immediate reversal. The stock can hold near the top of its range while excess enthusiasm cools, especially if broader participation remains intact.
Volatility & Volume
Volatility is moderate, not explosive. The ATR(14) at 0.68 SGD, equal to 2.2% of price, suggests daily swings are present but not disorderly. Meanwhile, the Bollinger band width of 14.8% is described as normal, which means the market is not in a compression phase that would usually precede a sharp breakout. In other words, the stock has room to move, but the setup does not yet scream for a volatility expansion.
Volume adds a second layer of caution. The latest turnover of 6,443,600 was below the 20-hour average of 7,201,264, or about 0.9× normal. That tells us the latest slip was not accompanied by heavy distribution, which reduces the urgency of the decline. At the same time, OBV is rising, meaning cumulative volume flow still leans positive. That is a useful signal because it suggests buyers have been accumulating shares over time even if the most recent session was softer. The message from volume is therefore not panic, but a market that is pausing under resistance with participation still broadly supportive.
Key Levels & Scenarios
The nearest line in the sand is 31.79 SGD, with the broader overhead test at 31.86 SGD. A clear move through that zone would indicate the stock is no longer just hovering near the top of its range, but attempting to reassert the trend into fresh highs. On the downside, 29.70 SGD is the key moving-average support, and 28.63 SGD is the more immediate range floor. If price loses that support band, the current bullish structure would begin to look less secure, especially with oscillators already overbought.
The Bollinger lower band at 27.50 SGD gives a deeper reference point for stress, but the market would not need to fall that far for momentum to weaken. A failure to hold above the middle band at 29.70 SGD would be the first sign that the recent advance is cooling more than expected. By contrast, holding above that level while MACD stays positive would keep the trend intact, even if the stock continues to consolidate beneath resistance.
Technical Verdict: HOLD (wait & see)
- RSI at 74.3 and Stochastic at 90.7/95.5 show the stock is overbought, so the upside is extended in the short term.
- MACD at 1.194 above signal 1.067 still supports the trend, so the broader structure has not broken.
- Price above SMA20 at 29.70 and SMA50 at 27.15 keeps the medium-term trend constructive, but 31.79/31.86 SGD remains a near-term ceiling.
- Verdict invalidated if price falls below 28.63 SGD, which would weaken the current range support and challenge the uptrend structure.
- Ideal Entry Range: 29.70 to 28.63 SGD
- Exit Target: 31.79 to 31.90 SGD
- Stop Loss protection: below 27.50 SGD
For non-traders, this means OCBC still looks technically healthy, but the stock is stretched enough that the market may need to pause before deciding whether to push through the 31.79 to 31.90 SGD barrier.
Summary Data OCBC
| Last price | 30.95 SGD |
| Change 1 day / 5 days / 1 month | -2.64% / 2.15% / 8.37% |
| Trend / MA-cross | uptrend / none |
| SMA20 / SMA50 | 29.70 / 27.15 |
| RSI (14) / Stochastic %K | 74.3 / 90.7 |
| Bollinger %B / ATR | 78% / 0.68 |
| Support / Resistance 20 days | 28.63 / 31.79 |
| Data as of | 17 Agustus 2026 08:00 WIB |


