Momentum Weakens, HSBC Stock Gains 0.81% Today
On Agustus 19, 2026: price 162.10 HKD, trend sideways, RSI 58.9, support 156.50, resistance 168.20. technical analysis of hsbc stock. Momentum Weakens — full…

HSBC Holdings’ Hong Kong-listed shares closed at 162.10 HKD, up 0.81% on the day, but the bigger signal is that the stock is still sitting below its 20-day moving average at 162.57 even after a modest bounce. That matters because the 20-day line often acts like a short-term balance point: trading under it says the market has not yet fully reclaimed near-term control, even though the broader structure remains above the 50-day moving average at 154.34. The result is a picture of a stock that is not trending decisively, but is also not breaking down.
Trend & Price Action
The chart shows HSBC in a sideways trend, with the 20-day average rising at 0.96% over 5 days. That slope is important: it suggests the short-term base is still inching higher, but without the kind of clean momentum that usually drives a sustained leg up. Price is also positioned in the lower-middle part of its recent range, at 48% of the 20-day support-to-resistance band, which leaves room in both directions rather than signaling a breakout already underway.
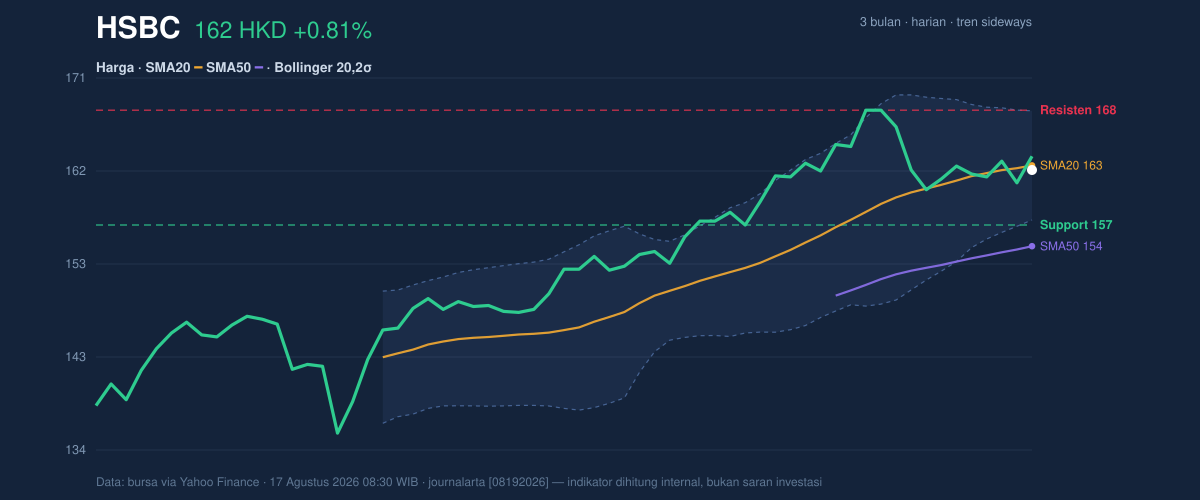
The key message from price structure is simple: HSBC is hovering near the middle of the board, not near the edge. A stock that remains under the 20-day average while holding above the 50-day line is often in a consolidation phase, where traders are waiting for either a reclaim of short-term trend or a loss of support to define the next move. The 3-month high at 169.70 and 3-month low at 133.50 frame that range clearly.
A small bounce, but not a clean turn.
Oscillators & Momentum
Momentum indicators are mixed rather than aligned. The RSI at 58.9 is neutral, which means the stock is neither stretched nor oversold; it is sitting in the middle zone where price can still move either way without an immediate exhaustion signal. The Stochastic %K at 49.2 and %D at 40.4 also read neutral, suggesting the short-term pace has improved but not enough to confirm a strong upswing. In plain terms, the oscillators are not flashing danger, but they are not confirming a forceful breakout either.
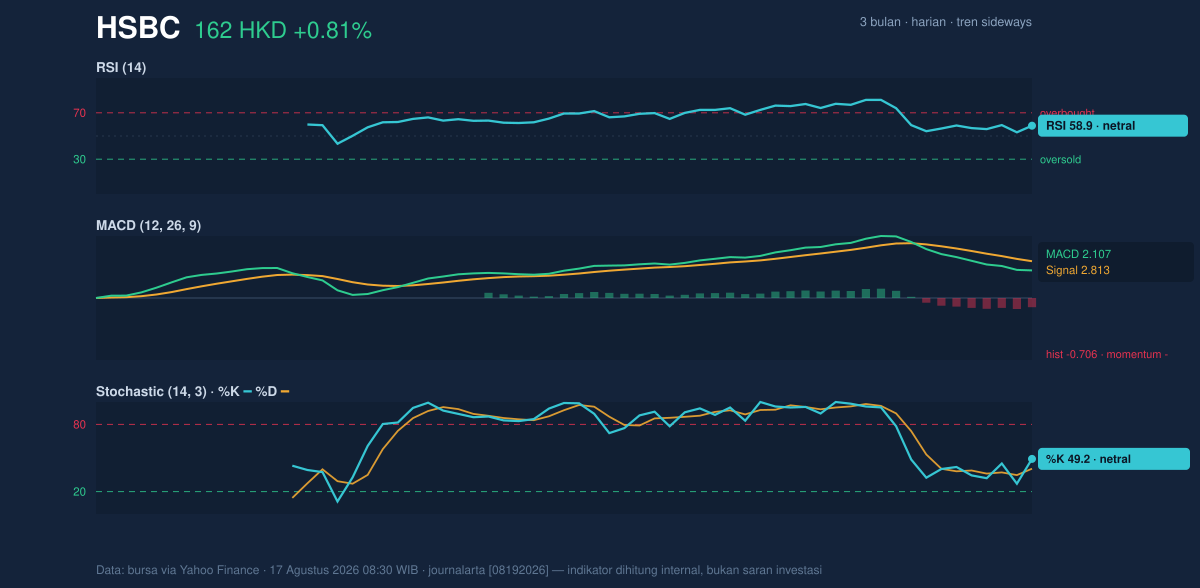
The clearer warning comes from MACD. The MACD at 2.107 is below the signal line at 2.813, leaving a -0.706 histogram. That negative histogram means short-term momentum has slipped under the trend signal, a common sign that the recent bounce is losing energy even while the broader price structure remains intact. In a sideways market, that kind of setup often points to hesitation rather than immediate trend reversal.
Volatility & Volume
Bollinger Bands are tightening: the band width is just 6.8%, a classic squeeze setup that often precedes a larger move. The middle band sits at 162.57, almost exactly where the 20-day average stands, while the upper band is 168.14 and the lower band is 157.01. With %B at 46%, price is sitting slightly below the midline, which reinforces the idea that HSBC is still balanced rather than extended.
That squeeze matters more because volume is not yet confirming conviction. The latest volume of 7,607,874 is only about 0.5× the 20-day average of 13,904,273, and OBV is falling. OBV, or on-balance volume, tracks whether trading volume is flowing in the direction of price; a decline there suggests buyers are not yet showing enough participation to validate a stronger advance. In short, the chart is compressed, but the trading crowd is quiet.
Quiet volume, tight bands, unfinished momentum.
Key Levels & Scenarios
The immediate map is straightforward. Support at 156.50 is the first line to watch, while resistance at 168.20 sits just above the Bollinger upper band at 168.14. That close alignment is useful: it means the market has a clearly defined ceiling in the near term. If HSBC can move through that zone, the chart would be testing the upper edge of its recent structure and the squeeze could start to resolve upward. If it cannot, the stock may keep rotating around the 20-day average.
The fact that price is above the 50-day average but below the 20-day average is the most telling technical contradiction in the setup. It says the medium-term trend still has a constructive base, but the short-term tape has not fully joined it. That gap is often where consolidation lives: the market is stable enough to avoid panic, but not strong enough to accelerate.
Technical Verdict: HOLD (wait & see)
HOLD (wait & see) fits best because the chart is balanced, not decisive. Price is below the 20-day moving average, which caps near-term momentum; MACD is negative versus its signal line, showing the bounce lacks confirmation; and Bollinger Bands are squeezing, which signals an upcoming move but not the direction yet.
- Ideal Entry Range: 157.01 to 162.57
- Exit Target: 168.14 to 168.20
- Stop Loss protection: below 156.50
The verdict is invalidated if price falls below 156.50, because that would break the nearest support and weaken the current range structure.
For non-traders: HSBC’s chart is compressed and waiting for a direction, but the momentum is not strong enough yet to call it a clean move.
The latest volume was 7,607,874 shares.
Summary Data HSBC
| Last price | 162.10 HKD |
| Change 1 day / 5 days / 1 month | 0.81% / -0.25% / 2.72% |
| Trend / MA-cross | sideways / none |
| SMA20 / SMA50 | 162.57 / 154.34 |
| RSI (14) / Stochastic %K | 58.9 / 49.2 |
| Bollinger %B / ATR | 46% / 2.99 |
| Support / Resistance 20 days | 156.50 / 168.20 |
| Data as of | 17 Agustus 2026 08:30 WIB |


