Singtel Stock Technicals Today: Drops 0.22%, Momentum Weakens
On Agustus 19, 2026: price 4.44 SGD, trend sideways, RSI 53.9, support 4.25, resistance 4.61. technical analysis of singtel stock. Singtel Stock Technicals —…

Singapore Telecom’s shares on the Singapore Exchange edged down to SGD 4.44 on 17 August 2026, slipping 0.22% from the previous close as the stock stayed in a narrow, sideways pattern, according to market data compiled from Yahoo Finance. The move is modest, but the message matters: Singtel is trading above its short- and medium-term averages, yet the tape is not showing the kind of force that usually marks a decisive re-rating.
Trend & Price Action
The stock is sitting above its SMA20 at SGD 4.41 and above its SMA50 at SGD 4.39, which tells traders that the recent drift is still constructive even if it is not strongly directional. The absence of a fresh MA-cross matters because it suggests the market has not yet produced a new trend signal; in plain language, the short-term average is not pulling away from the longer-term average in a way that would confirm a stronger breakout or breakdown.
As shown in the chart, Singtel is trading in the upper half of its 20-hour range between SGD 4.25 and SGD 4.61, with the last price positioned around 53% of that band. That placement is important because it shows the stock is not under immediate downside pressure, but it is also not pressing into resistance with conviction. The broader three-month backdrop reinforces that reading: the share price remains below the 3-month high of SGD 5.05 and above the 3-month low of SGD 4.15, which is consistent with a market that has stabilised but not escaped its range.
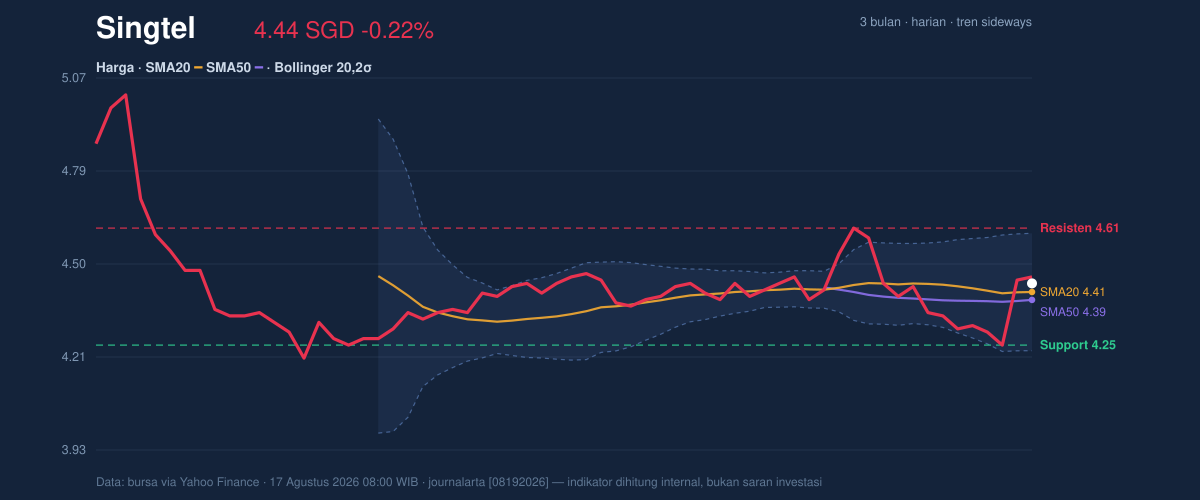
The short-term slope of the SMA20 is -0.39% over 5 days, so the moving average is still leaning lower even though price is above it. That combination often signals a market in transition, where buyers have absorbed some selling but have not yet reversed the broader drift. In other words, the chart is improving, but only gradually.
Oscillators & Momentum
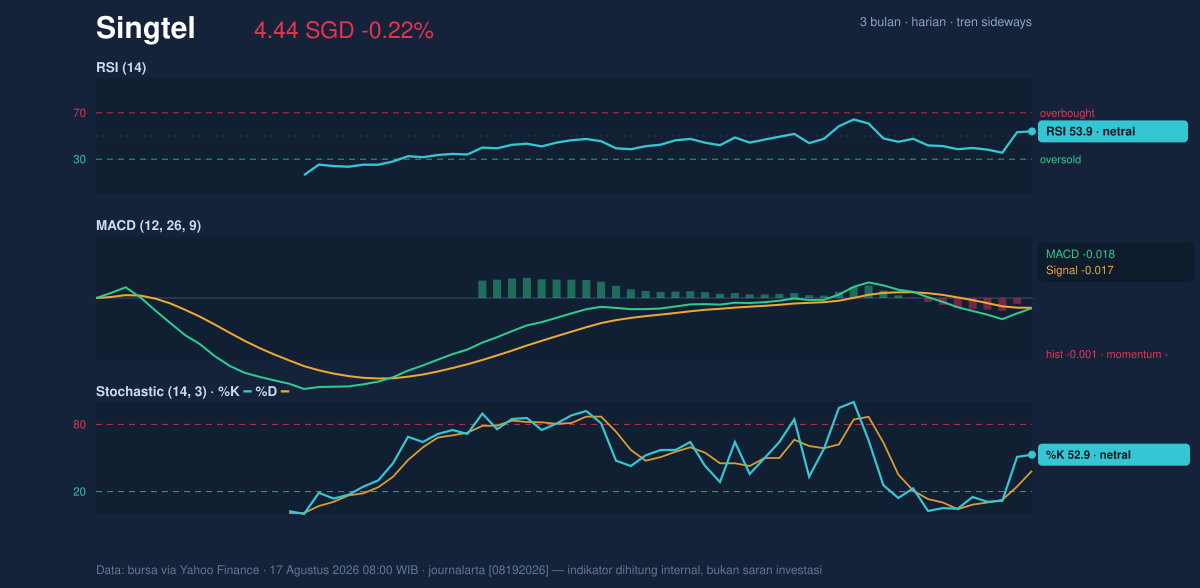
Momentum indicators are mostly neutral, which fits the sideways structure. The RSI at 53.9 sits near the middle of its scale, neither overbought nor oversold, so it is not warning of exhaustion and it is not flashing a bargain signal either. The Stochastic at 52.9 / 38.6 is also neutral, though the gap between %K and %D suggests the short-term bounce has not fully lost traction.
The more cautionary signal comes from the MACD at -0.018 versus signal -0.017, with a histogram of -0.001. That tiny negative spread means momentum is still slightly below its trigger line, so the stock has not yet generated a clean bullish confirmation. For non-specialists, MACD is a trend-following gauge: when it turns positive and widens, it usually means buying pressure is starting to outpace selling pressure. Here, that shift has not happened decisively.
The broader interpretation is straightforward. Singtel’s oscillators are not weak enough to imply immediate breakdown risk, but they are also not strong enough to support an aggressive upside read. The chart is balanced, and balance tends to persist until volume or price closes the argument.
Volatility & Volume
Bollinger positioning adds another layer. The stock is trading near the middle of its Bollinger band structure, with %B at 57%, the upper band at SGD 4.59, the middle band at SGD 4.41, and the lower band at SGD 4.23. That tells readers the price is slightly above the midline but not close enough to the upper band to suggest overheating. The 8.2% band width is normal, not compressed, so the market is not sitting in a deep volatility squeeze that would typically precede a sharp move.
ATR, or average true range, stands at 0.11, equal to 2.4% of price, which points to moderate day-to-day movement. That matters because it frames what a “normal” swing looks like: Singtel is not behaving like a highly volatile momentum name, and any breakout attempt is likely to need follow-through rather than just one strong session.
Volume is the more telling weak spot. The latest turnover of 14,919,100 shares was only about 0.4x the 20-hour average of 34,447,668, and OBV is falling. OBV, or on-balance volume, tracks whether volume is accumulating on up days or draining on down days. A declining OBV alongside a stable price usually means participation is thinning, which can leave rallies fragile. The price may be holding, but the crowd is not fully committing.
Key Levels & Scenarios
The main support to watch is SGD 4.25, while the first resistance sits at SGD 4.61. These levels are useful because they frame the current range in practical terms. If Singtel can push through SGD 4.61 with stronger volume, the chart would begin to look less like a pause and more like a recovery attempt toward the upper part of the three-month range. If it slips back below SGD 4.25, the recent stability would lose credibility and the market would be forced to test whether the lower band near SGD 4.23 can still act as a floor.
The key signal to watch is not just direction, but participation. A move that lacks volume and leaves OBV falling tends to fade; a move that arrives with heavier trading usually carries more weight. As shown in the chart, the stock is currently in the middle of that decision zone.
Technical Verdict: HOLD (wait & see)
HOLD (wait & see)
- Price is above SMA20 and SMA50, which supports the idea that the stock is still structurally intact.
- MACD remains slightly negative, so momentum has not confirmed a stronger upside turn.
- Volume is only 0.4x average and OBV is falling, which weakens the case for a durable breakout.
Verdict invalidated if price falls below SGD 4.25.
- Ideal Entry Range: SGD 4.25 to SGD 4.41
- Exit Target: SGD 4.59 to SGD 4.61
- Stop Loss protection: below SGD 4.23
In plain English: the stock is holding its ground, but it has not yet shown enough strength to prove the next move is underway.
The latest reading from Yahoo Finance shows Singtel at SGD 4.44 with OBV down.
Summary Data Singtel
| Last price | 4.44 SGD |
| Change 1 day / 5 days / 1 month | -0.22% / 3.26% / 0.00% |
| Trend / MA-cross | sideways / none |
| SMA20 / SMA50 | 4.41 / 4.39 |
| RSI (14) / Stochastic %K | 53.9 / 52.9 |
| Bollinger %B / ATR | 57% / 0.11 |
| Support / Resistance 20 days | 4.25 / 4.61 |
| Data as of | 17 Agustus 2026 08:00 WIB |


