UOB Testing Support Level: Stock Drops 2.20% (Agustus 19, 2026)
On Agustus 19, 2026: price 40.88 SGD, trend sideways, RSI 38.3, support 41.13, resistance 43.89. technical analysis of uob stock. UOB Testing Support Level —…

United Overseas Bank shares on SGX slipped to SGD 40.88 in the latest session, extending a soft patch that has left the counter below both its short- and medium-term averages. The move matters because it is not just a one-day dip: the price is now trading below the SMA20 at SGD 42.88 and also below the SMA50 at SGD 41.51, a combination that usually tells traders the stock is losing traction rather than merely pausing. As shown in the chart, UOB is still inside a broad sideways structure, but the balance of signals is leaning defensive.
Trend & Price Action
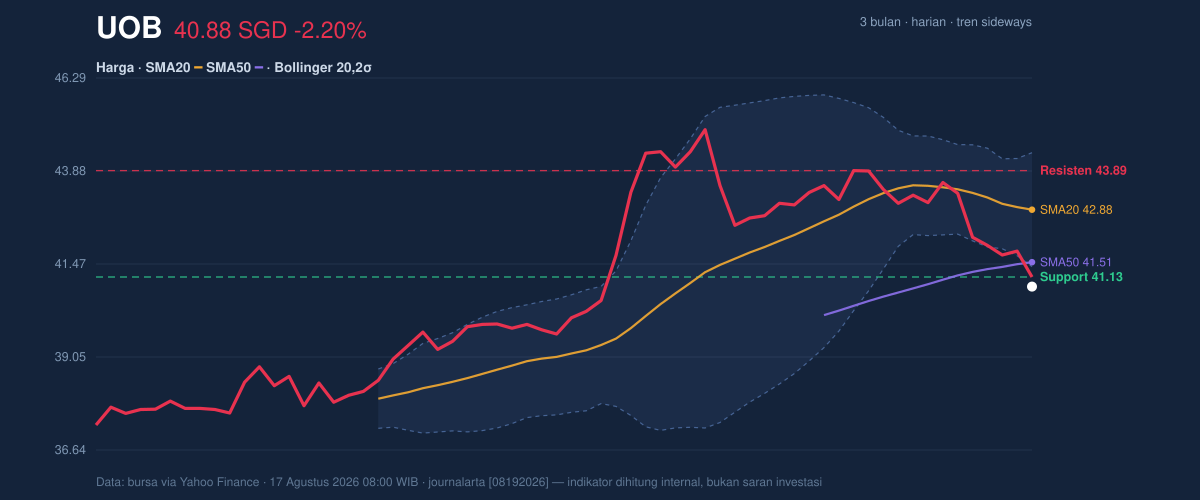
The chart shows a stock that has drifted to the lower half of its recent range, with the latest print sitting 9% from the 20-hour range low and well under the 20-hour resistance at SGD 43.89. That positioning is important: when price sits near the bottom of its short-term band, it often means sellers are still in control and buyers have not yet shown enough conviction to reclaim the trend. The broader picture is not a collapse, though. UOB remains within its 3-month range of SGD 37.07 to SGD 45.15, which suggests the market is still treating this as a consolidation phase rather than a broken structure.
The slope of the SMA20 is -1.21% over 5 days, which reinforces the idea that the near-term trend is tilting lower. There is no fresh MA cross, so the chart is not flashing a major trend reversal signal yet. Instead, the price is simply sitting under pressure, with the moving averages acting as overhead supply. In plain terms, that means rallies may face selling before they can turn into a sustained recovery.
Oscillators & Momentum
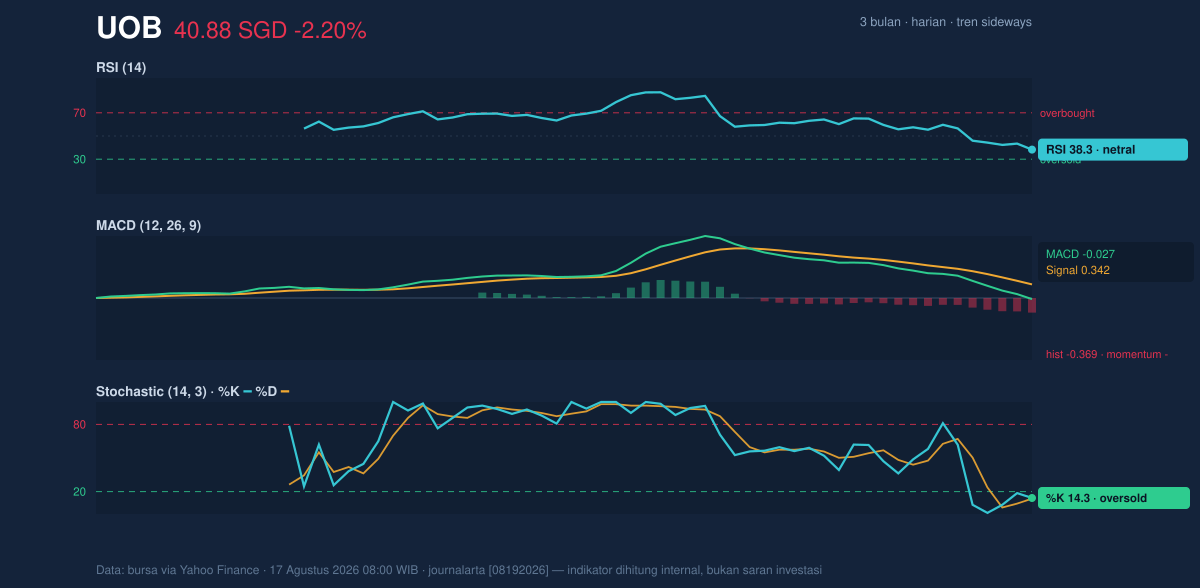
Momentum indicators are mixed, and that mix is telling. The RSI at 38.3 is still described as neutral, but it is close enough to the lower end of the scale to show fading strength rather than outright panic. The Stochastic %K at 14.3 and %D at 13.7 sit in oversold territory, which often means the stock is stretched on the downside in the short term and could bounce if selling slows. But oversold does not automatically mean reversal; it only means the decline may be getting mature.
The more important signal is the MACD at -0.027, with the signal line at 0.342 and a histogram of -0.369. That combination points to negative momentum still dominating. In practical terms, the stock is not yet showing the kind of momentum turn that would confirm a durable rebound. The oscillators are therefore split: Stochastic says the stock is becoming short-term extended, while MACD says downside momentum has not fully cleared.
Volatility & Volume
The Bollinger setup adds another layer. UOB’s Bollinger upper band is SGD 44.35, the middle band is SGD 42.88, and the lower band is SGD 41.40. The price is trading below the lower band, and the %B at -18% shows the stock is outside the normal volatility envelope on the weak side. That often reflects a short-term overshoot, but it can also signal that the market is pricing in more downside risk before stabilising. The 6.9% band width is relatively tight and described as a squeeze, which means volatility has compressed and a sharper move could follow once the current pressure resolves.
Volume is not confirming a strong rebound. The latest turnover of 2,518,800 is only 0.7 times the 20-hour average of 3,724,233, and OBV is falling. That matters because falling on lighter participation can sometimes limit the speed of a decline, but a declining OBV still suggests net distribution — more shares are leaving hands than entering them. The ATR of 0.78, equal to 1.9% of price, says daily swings remain moderate rather than extreme, so the next move may unfold in a measured way unless the squeeze breaks decisively.
Key Levels & Scenarios
The immediate technical map is fairly clear. SGD 41.13 is the nearest support from the 20-hour range, and the price is already hovering below it, which makes that level a near-term reclaim point rather than a cushion already secured. On the upside, SGD 43.89 is the first resistance to watch, followed by the Bollinger upper band at SGD 44.35. If price can push back above the middle band at SGD 42.88, it would signal the stock is trying to re-enter the normal range after trading beneath it.
If UOB fails to recover SGD 41.13, the chart leaves room for a retest of the lower end of the broader range near SGD 37.07. If it does reclaim SGD 42.88 and then SGD 43.89, the market would be showing that the squeeze is resolving upward rather than extending the current weakness. For now, the burden of proof sits with the bulls.
Technical Verdict: HOLD (wait & see)
HOLD (wait & see) is the cleanest reading from the chart because the stock is weak but not broken, and the indicators are not aligned enough to justify a stronger directional call.
- Reason 1: Price is below the SMA20 and SMA50, which keeps the near-term trend under pressure.
- Reason 2: MACD remains negative, showing downside momentum is still in place.
- Reason 3: Stochastic is oversold and Bollinger bands are squeezed, which raises the chance of a reaction move, but not yet a confirmed reversal.
Verdict invalidated if price breaks below SGD 37.07, the 3-month low, because that would mean the broader range has failed.
- Ideal Entry Range: SGD 41.13 to SGD 42.88
- Exit Target (Target Price): SGD 43.89 to SGD 44.35
- Stop Loss protection: below SGD 37.07
For non-traders, this means UOB is in a weak patch, but the chart is also close to a point where it could stabilise if sellers lose momentum.
Summary Data UOB
| Last price | 40.88 SGD |
| Change 1 day / 5 days / 1 month | -2.20% / -5.59% / -3.74% |
| Trend / MA-cross | sideways / none |
| SMA20 / SMA50 | 42.88 / 41.51 |
| RSI (14) / Stochastic %K | 38.3 / 14.3 |
| Bollinger %B / ATR | -18% / 0.78 |
| Support / Resistance 20 days | 41.13 / 43.89 |
| Data as of | 17 Agustus 2026 08:00 WIB |

