Testing Key Resistance, DIS Stock Gains 2.63% Today
On Agustus 25, 2026: price 110.61 USD, trend uptrend, RSI 69.8, support 96.16, resistance 110.61. technical analysis of dis stock. Testing Key Resistance —…

Walt Disney Co. shares closed at 110.61 on the NYSE, up 2.63% on the day and 14.44% over the past month, with the stock now pressing against the top of its recent range, according to market data from Yahoo Finance. The move matters because it is not just a one-day bounce: Disney is trading above both its SMA20 at 102.95 and SMA50 at 100.07, a positioning that usually tells investors the market is still rewarding the stock for strength rather than fading it. But the chart also shows a more delicate point: the shares are sitting almost exactly at the Bollinger upper band at 110.95, which means the latest advance is testing the edge of what the recent trend has already priced in.
That is the core tension in Disney right now. Momentum is positive, but the stock is also stretched.
Trend & Price Action
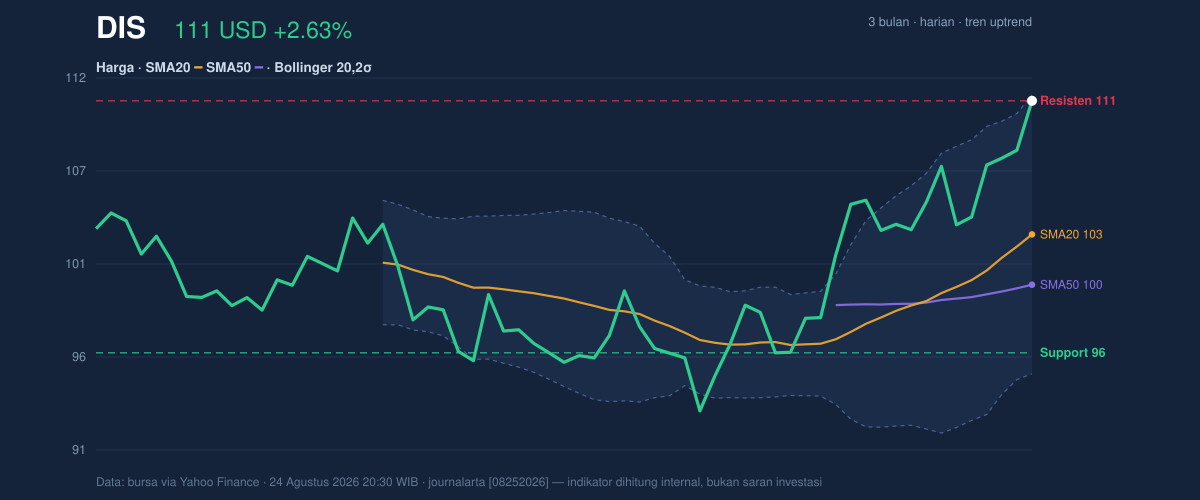
The broader setup remains constructive. The uptrend is intact, and the SMA20 slope of 3.01% over 5 days shows the short-term average is still rising rather than flattening out. That matters because a rising moving average often reflects persistent demand: buyers have been willing to step in at progressively higher prices, not just chase a single headline-driven spike. The absence of a new MA-cross is also important. It means the trend has not been reinforced by a fresh crossover signal, so the move is being carried more by price itself than by a newly confirmed longer-term shift.
[ GRAFIK-HARGA ]
As shown in the chart, Disney is now at 100% of its 20-day range, with the 20-day support at 96.16 and the 20-day resistance at 110.61. In plain language, the stock has reached the ceiling of its recent trading corridor. That is often where momentum can either extend into a breakout or pause as traders take profits.
The stock is also only a fraction below the 3-month high of 111.87, which reinforces the idea that the market is testing a breakout zone rather than recovering from weakness. If the shares can clear that nearby high, the chart would shift from “strong rebound” to “new leg higher”; if not, the current level may become a place where the advance cools.
Oscillators & Momentum
[ GRAFIK-MOMENTUM ]
The momentum indicators are mixed, and that mix is the most informative part of the story. The RSI at 69.8 is still described as neutral in the data, but it is sitting close to the overbought threshold, which signals that the stock is no longer cheap in short-term momentum terms. More striking is the Stochastic %K at 89.7 and %D at 89.9, both in overbought territory. Stochastic measures where the stock sits within its recent price range, so readings this high mean Disney has been closing near the top of that range for long enough that the move may be getting crowded.
The MACD at 2.604 remains above its signal line at 1.916, with a histogram of 0.688. That combination means upward momentum is still alive and has not yet rolled over. In practical terms, MACD is saying the trend still has fuel, even if shorter-term oscillators are warning that the stock is getting extended. This is a classic late-stage strength pattern: the trend is healthy, but the speed of the move is beginning to outpace the room left in the current setup.
Volatility & Volume
Volatility is not flashing panic. The ATR at 2.48, or 2.2% of price, suggests movement is active but still orderly. That is important because a stock can be strong without being chaotic; Disney’s current ATR says traders should expect normal-sized daily swings rather than a disorderly breakout or collapse.
Volume supports the move. Last trade volume of 12,658,400 was about 1.2x normal versus the 20-day average of 10,776,870, and OBV is rising. That combination means the advance is not happening on thin participation. Rising OBV is especially useful because it implies volume has been accumulating on up days more than on down days, a sign that buyers are not just present, but persistent.
The Bollinger band width of 15.5% is described as normal, so this is not a squeeze waiting to explode. Instead, the stock is moving within a standard volatility envelope, and the fact that %B is 98% tells you price is hugging the upper band. That is bullish in the short term, but it also means the stock is running close to the upper boundary of its recent statistical range.
Key Levels & Scenarios
The immediate map is straightforward. The first level to watch is the 110.95 upper Bollinger band, followed by the 3-month high at 111.87. Those are the obvious resistance markers because they define where the current move may need fresh buying to continue. On the downside, the first meaningful cushion is the SMA20 at 102.95, then the SMA50 at 100.07, with the broader 20-day support at 96.16 below that.
If Disney holds above the moving averages and can push through the upper band and recent high, the chart would suggest continuation rather than exhaustion. If it fails to do so, the overbought stochastic reading raises the chance of a pause or pullback toward the midline of the Bollinger structure.
Technical Verdict: HOLD (wait & see)
HOLD (wait & see)
- MACD is positive, so the trend still has upward momentum.
- Price is above SMA20 and SMA50, confirming the stock remains in an established uptrend.
- Stochastic is overbought and %B is 98%, which suggests the shares are stretched near resistance.
Verdict invalidated if price falls below 102.95 and loses the short-term trend base.
- Ideal Entry Range: 102.95 to 100.07
- Exit Target: 110.95 to 111.87
- Stop Loss protection: below 96.16
For non-traders, this means Disney still looks strong, but the stock is close enough to resistance that patience matters more than urgency.
“The market is still buying the story, but it is no longer buying it cheaply.”
Summary Data DIS
| Last price | 110.61 USD |
| Change 1 day / 5 days / 1 month | 2.63% / 6.87% / 14.44% |
| Trend / MA-cross | uptrend / none |
| SMA20 / SMA50 | 102.95 / 100.07 |
| RSI (14) / Stochastic %K | 69.8 / 89.7 |
| Bollinger %B / ATR | 98% / 2.48 |
| Support / Resistance 20 days | 96.16 / 110.61 |
| Data as of | 24 Agustus 2026 20:30 WIB |



