AstraZeneca Stock Technicals Today: Gains 1.93%, Momentum Gains
On Agustus 26, 2026: price 12,476.00 GBp, trend sideways, RSI 47.1, support 11,460.00, resistance 13,134.00. technical analysis of astrazeneca stock.

According to the London Stock Exchange data at 24 August 2026 14:00 WIB, AstraZeneca shares last traded at 12,476.00 GBp, up 1.93% on the day and 7.92% over five days, even as the stock remains 3.20% lower over one month. That mix matters: it shows a rebound inside a broader sideways pattern, not a clean trend reversal. The price is now above SMA20 at 12,050.30 but still below SMA50 at 12,840.80, which tells traders the share has recovered short-term footing without yet reclaiming the medium-term trend line.
Trend & Price Action
The chart shows a stock that is trying to stabilise rather than break decisively in either direction. The sideways trend is reinforced by the SMA20 slope of -1.29% over five days, a reminder that the nearer-term bias has not fully turned up. At the same time, the latest price sitting above the 20-day average suggests buyers have defended the recent dip. That combination usually signals a market in transition: short-term momentum is improving, but the broader structure still needs confirmation from the SMA50 at 12,840.80.
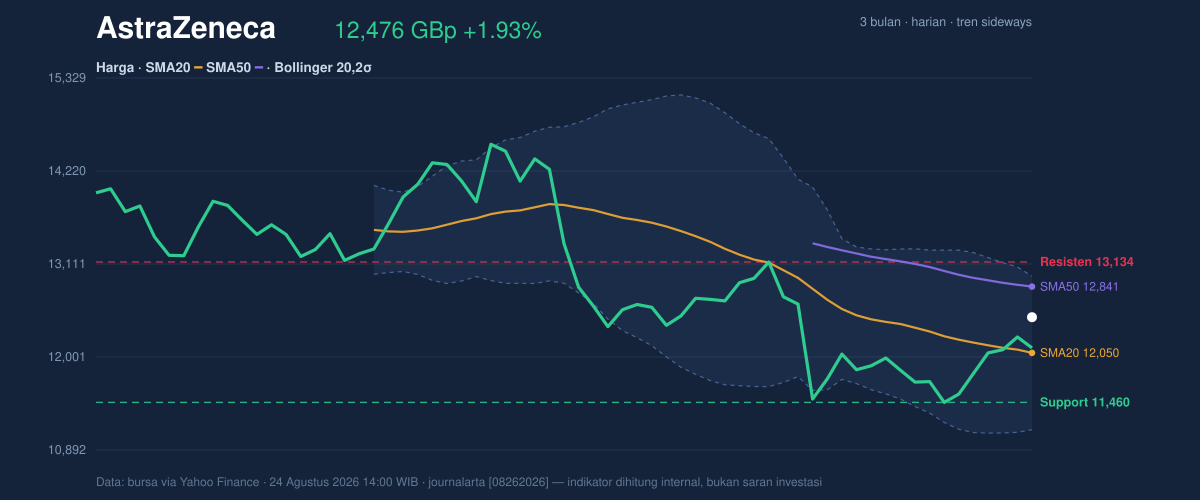
Price is trading at 61% of the 20-day range, which places it in the upper half of the recent band but not close enough to resistance to imply a breakout has already happened. The nearest support at 11,460.00 is meaningful because it sits well below current trading and marks the area where the market has previously found buyers. Above, resistance at 13,134.00 is the first obvious ceiling. A move through that level would not just be a numerical breach; it would mean the market has absorbed recent supply and is starting to challenge the upper part of the range around the 3-month high of 15,126.00.
Oscillators & Momentum
The momentum picture is more nuanced than the trend picture. RSI at 47.1 is neutral, which means the stock is neither stretched nor washed out on that measure. That is important because it leaves room for movement in either direction. By contrast, Stochastic %K at 81.1 and %D at 85.3 are in overbought territory, as shown in the momentum chart. In plain English, the recent bounce has been fast enough to push the short-term oscillator into a crowded zone, where upside can continue but becomes more vulnerable to pauses or pullbacks.
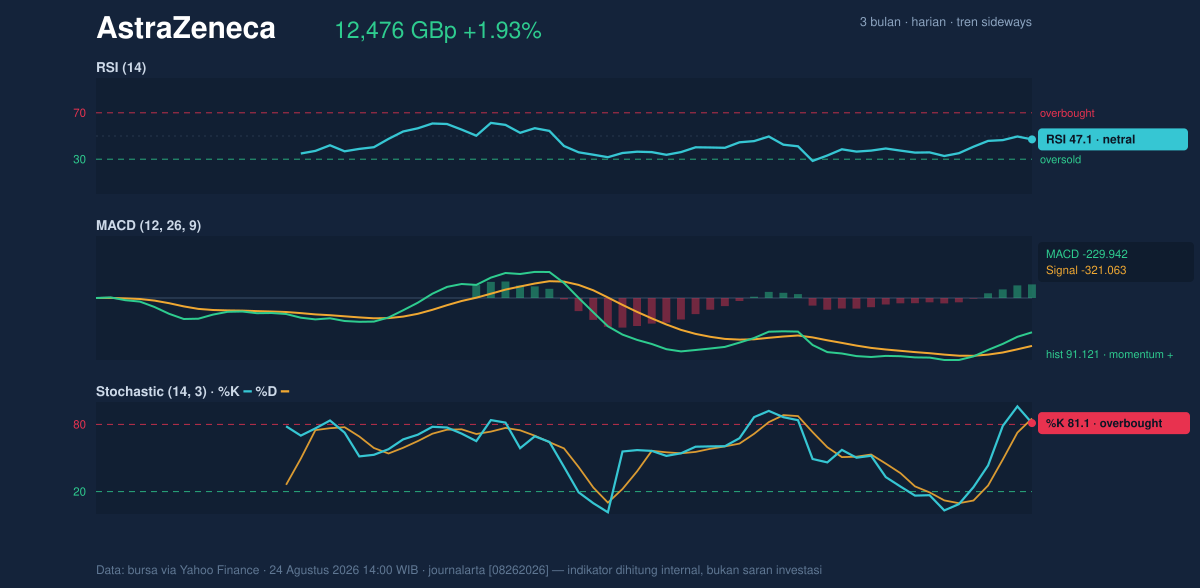
The MACD at -229.942 remains below zero, but the histogram at 91.121 is positive and the MACD line is above the signal line at -321.063. That is a constructive signal. It means downside momentum has been easing and the short-term trend is improving even though the broader MACD reading is still negative. Put differently, the stock is not yet in a confirmed bullish phase, but the momentum has shifted from deterioration toward repair. That is a better setup than a flat or weakening histogram, especially when paired with a price that is reclaiming the 20-day average.
Volatility & Volume
Bollinger bands are helping frame the move. The price sits around %B 73%, which means it is trading in the upper portion of the band but not pressing the upper boundary at 12,965.75. The band width of 15.2% is described as normal, so the market is not in a volatility squeeze that would typically precede a sharp expansion. Instead, the setup suggests orderly trading with room to extend if buyers keep control. The ATR at 294.23, or 2.4% of price, confirms that daily swings are moderate rather than extreme.
Volume, however, tempers the optimism. The latest turnover of 1,791,745 is only 0.4× the 20-day average of 4,493,053, so the bounce is happening on quiet participation. That matters because rallies built on thin volume can be easier to fade. Still, the OBV is rising, which suggests net accumulation has been better than the day’s raw volume suggests. In practical terms, the market may be seeing more steady buying than headline volume implies, but it has not yet attracted broad participation.
Key Levels & Scenarios
The key technical question is whether AstraZeneca can convert the current rebound into a move through overhead supply. If the price holds above 12,050.30, the 20-day average, the short-term structure stays constructive. If it then clears 12,840.80, the stock would be reclaiming the medium-term average as well, which often acts as an important signal that a sideways phase is giving way to a stronger recovery. Failure to hold the 20-day line would weaken that case quickly. A drop back toward 11,460.00 would bring the lower support zone back into focus and suggest the recent bounce was only a countertrend move.
The upper band at 12,965.75 and the 20-day resistance at 13,134.00 are close enough to matter together. The first level marks the Bollinger ceiling; the second marks the range cap. If price stalls between them, the market is likely still digesting the recent move. If it pushes through both, the chart would begin to look less like a bounce and more like a genuine trend repair. For now, the evidence is mixed: improving momentum, but not yet strong enough volume or trend confirmation to call it decisive.
Technical Verdict: HOLD (wait & see)
HOLD (wait & see) is the clearest reading from the current chart because the stock is above SMA20 at 12,050.30 and momentum has improved, but it is still below SMA50 at 12,840.80 and volume is running at only 0.4× the 20-day average. Stochastic is overbought, which raises the risk of a pause, while MACD is still negative even though the histogram is positive. The verdict would be invalidated if price breaks below 11,460.00, because that would put the nearest support back under pressure and weaken the rebound structure.
- Ideal Entry Range: 12,050.30 to 12,476.00, where price is holding above the 20-day average but has not yet run into the full resistance cluster.
- Exit Target (Target Price): 12,840.80 to 12,965.75, aligned with the 50-day average and the upper Bollinger band.
- Stop Loss protection: below 11,460.00, the nearest 20-day support.
Plain English: the shares look repaired but not yet proven.
Volume last traded: 1,791,745 versus 20-day average 4,493,053.
Summary Data AstraZeneca
| Last price | 12,476.00 GBp |
| Change 1 day / 5 days / 1 month | 1.93% / 7.92% / -3.20% |
| Trend / MA-cross | sideways / none |
| SMA20 / SMA50 | 12,050.30 / 12,840.80 |
| RSI (14) / Stochastic %K | 47.1 / 81.1 |
| Bollinger %B / ATR | 73% / 294.23 |
| Support / Resistance 20 days | 11,460.00 / 13,134.00 |
| Data as of | 24 Agustus 2026 14:00 WIB |


