HSBC Stock Technicals Today: Drops 0.09%, Testing Support Level
On Agustus 26, 2026: price 1,517.00 GBp, trend sideways, RSI 53.3, support 1,497.20, resistance 1,597.40. technical analysis of hsbc stock.

At 1,517.00 GBp on 24 August 2026 at 14:00 WIB, HSBC Holdings (HSBA.L) is trading just below its short-term average and inside a tightening range that is starting to matter more than the day’s tiny -0.09% move. The shares are below the SMA20 at 1,536.85 but still above the SMA50 at 1,494.48, a positioning that usually signals a market that has not broken down, yet has also not regained near-term control. As shown in the chart, the price is sitting in the lower part of the Bollinger envelope, which often means traders are waiting for a directional push rather than committing fresh money.
Trend & Price Action
The broader message is sideways trend, and the detail matters. The SMA20 is drifting lower at -0.39% over 5 days, so the short-term slope is still soft; that tells readers the recent bounce attempts have not yet changed the market’s tone. At the same time, the stock remains above the SMA50, which suggests the medium-term structure has not fully rolled over. In plain language, HSBC is caught between a weakening near-term trend and a still-intact longer base.
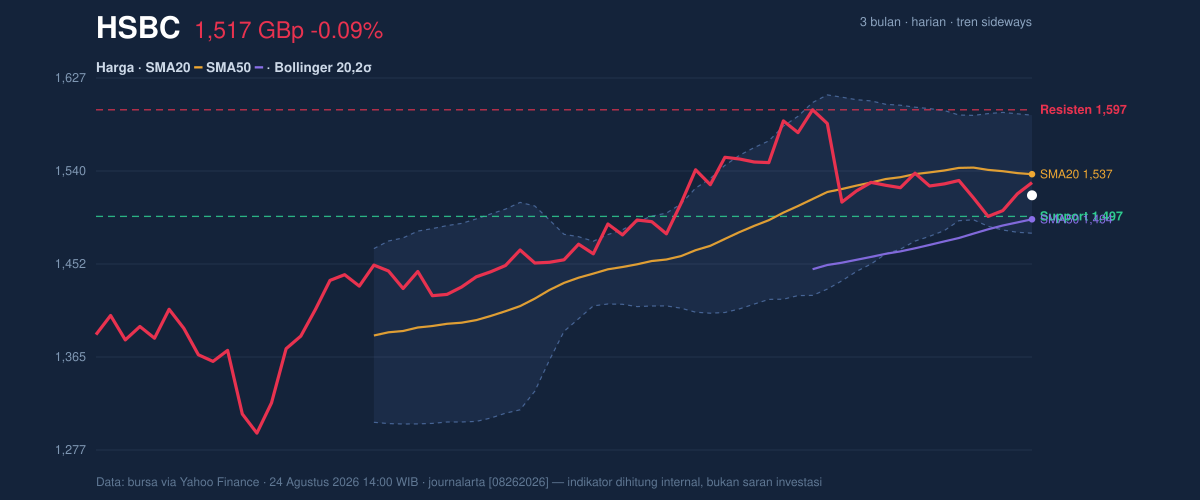
The Bollinger band structure reinforces that picture. The band width is only 7.2%, described here as a squeeze, meaning volatility has compressed and the market is storing energy. The price is at a %B of 32%, which places it closer to the lower half of the range than the upper edge. That does not confirm a breakdown on its own, but it does show the shares are not yet participating in a strong upside impulse. The 20-hour support at 1,497.20 is the first line that matters; if that floor gives way, the market would be testing the lower end of the current structure rather than just drifting within it.
The squeeze is the key signal: it means the next move could be sharper than the recent daily changes suggest.
Oscillators & Momentum
Momentum is mixed, and that is where the caution comes from. The RSI at 53.3 is neutral, which means the stock is neither stretched nor washed out. The Stochastic %K at 59.7 and %D at 37.5 is also neutral, but the gap between the two lines shows some upward recovery inside a broader range rather than a clean breakout signal. The more important read comes from MACD: the MACD at 4.418 sits below the signal at 10.265, leaving a -5.847 histogram. That negative histogram is a straightforward sign that recent price action is still losing momentum relative to the trend line used by the indicator.
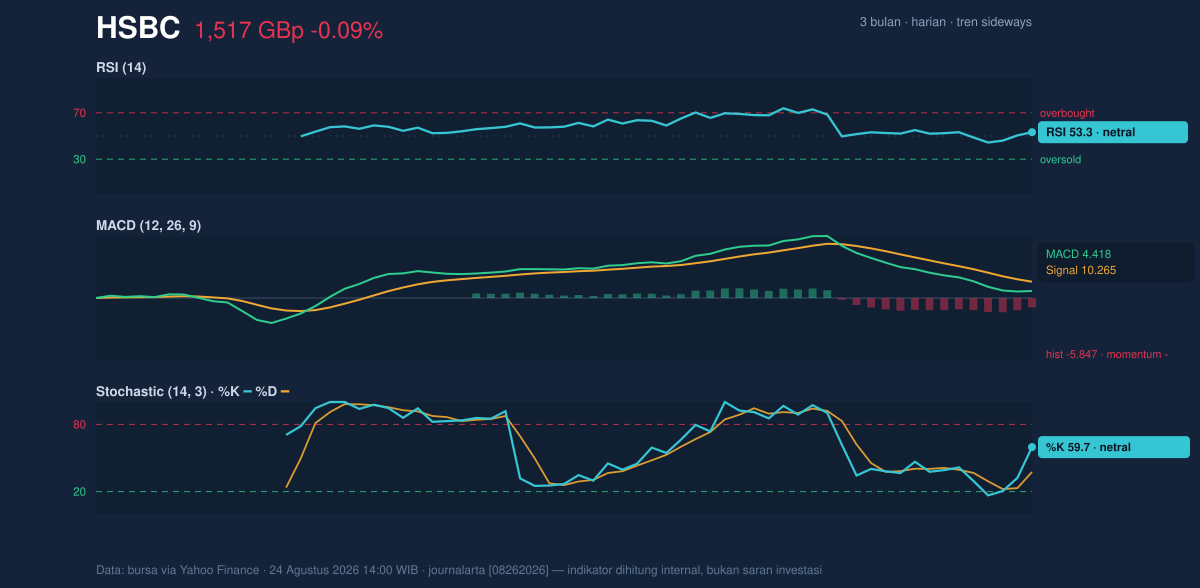
So while RSI and Stochastic are not warning of exhaustion, MACD momentum is negative, and that is a meaningful drag. In practical terms, it says the market has not yet generated enough follow-through to turn a sideways drift into a convincing advance. The absence of a fresh MA-cross also matters: when short and medium averages have not crossed decisively, the chart is usually telling traders that the market is still deciding rather than trending cleanly.
RSI is neutral, Stochastic is neutral, but MACD remains negative — that combination usually points to hesitation rather than conviction.
Volatility & Volume
Volatility is moderate, with ATR(14) at 28.86, equal to about 1.9% of price. That means the stock is moving enough to matter, but not enough to suggest panic. Combined with the Bollinger squeeze, this points to a market that may be preparing for expansion, even if the direction is not yet visible. In other words, the quiet can end abruptly.
Volume gives a different kind of signal. Last trade volume was 14,325,114, or about 0.5× the 20-hour average of 27,522,272. That is thin participation, which weakens the reliability of short-term moves because fewer shares are trading hands. Yet OBV is rising, and that matters because on-balance volume tracks whether money is quietly accumulating or leaving over time. Rising OBV against subdued daily volume can mean buyers are still present beneath the surface, even if they are not forcing a breakout yet.
Volume is light, but OBV rising suggests underlying accumulation is not absent.
Key Levels & Scenarios
The immediate map is clear. Support at 1,497.20 is the first practical test, and the stock is currently trading only slightly above it. Below that, the market would be moving toward the lower Bollinger band at 1,481.37 and closer to the SMA50 at 1,494.48, which is the line separating a shallow pullback from something more technically fragile. On the upside, resistance at 1,597.40 sits just under the 3-month high of 1,610.00. That makes the upper band at 1,592.33 a useful checkpoint: a move through it would show the squeeze is resolving upward, while failure there would keep the stock boxed in.
Because the price is in the lower 20% of the current range, the market is not pricing in a strong trend yet. If HSBC holds 1,497.20 and reclaims 1,536.85, the chart would begin to look less defensive. If it loses 1,497.20, the burden shifts to the lower band at 1,481.37 and the medium-term average at 1,494.48 to define whether this is just a pause or a deeper reset.
Technical Verdict: HOLD (wait & see)
HOLD (wait & see)
- MACD is negative with the histogram at -5.847, showing momentum is still fading.
- Price is below the SMA20 at 1,536.85, so the short-term trend has not been reclaimed.
- Bollinger bands are squeezing with width at 7.2%, which often precedes a move but does not reveal direction yet.
Verdict invalidated if price falls below 1,497.20, because that would weaken the current range floor and bring the lower band into focus.
- Ideal Entry Range: 1,497.20 to 1,536.85, where support and the SMA20 define the active decision zone.
- Exit Target (Target Price): 1,592.33 to 1,597.40, aligning with the upper Bollinger band and nearby resistance.
- Stop Loss protection: below 1,481.37, just under the lower Bollinger band and beneath the immediate support area.
In plain English: HSBC is not breaking out yet, but it is also not breaking down, and the next important move should start from the 1,497.20 support area.
Latest 3-month high and low: 1,610.00 / 1,267.20.
Summary Data HSBC
| Last price | 1,517.00 GBp |
| Change 1 day / 5 days / 1 month | -0.09% / -0.91% / -2.20% |
| Trend / MA-cross | sideways / none |
| SMA20 / SMA50 | 1,536.85 / 1,494.48 |
| RSI (14) / Stochastic %K | 53.3 / 59.7 |
| Bollinger %B / ATR | 32% / 28.86 |
| Support / Resistance 20 days | 1,497.20 / 1,597.40 |
| Data as of | 24 Agustus 2026 14:00 WIB |



