Alibaba Stock Analysis: Gains 0.96%, Testing Support Level
On Oktober 6, 2026: price 105.40 HKD, trend downtrend, RSI 41.7, support 104.40, resistance 114.80. technical analysis of alibaba stock.
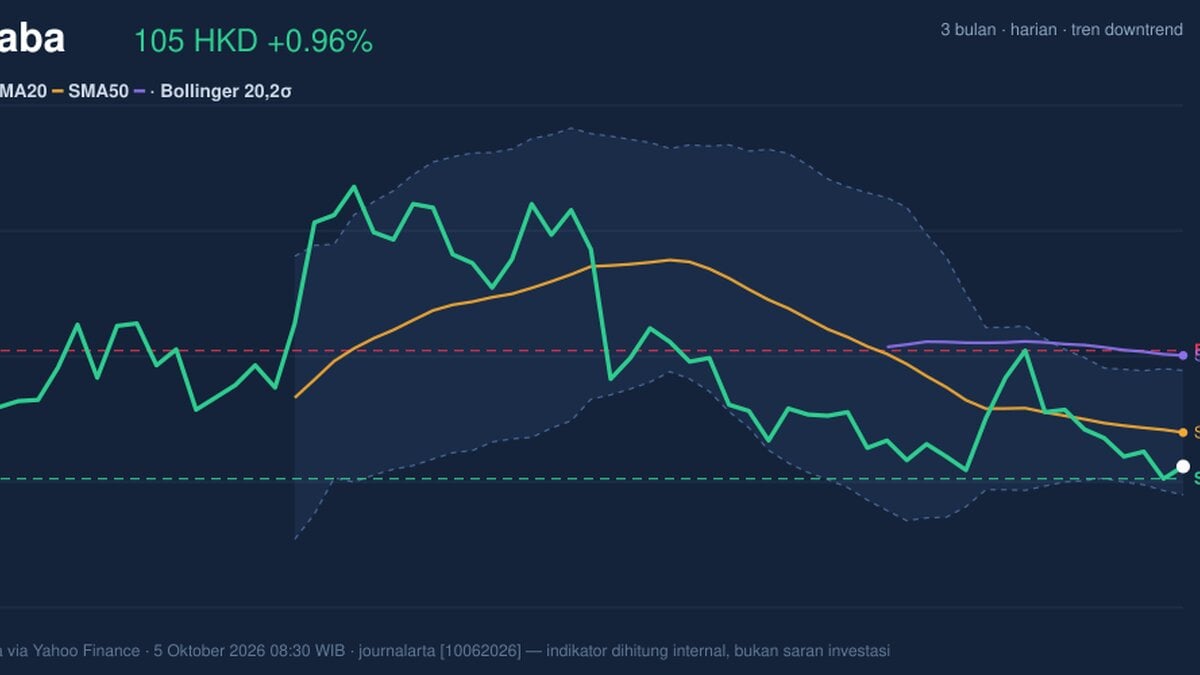
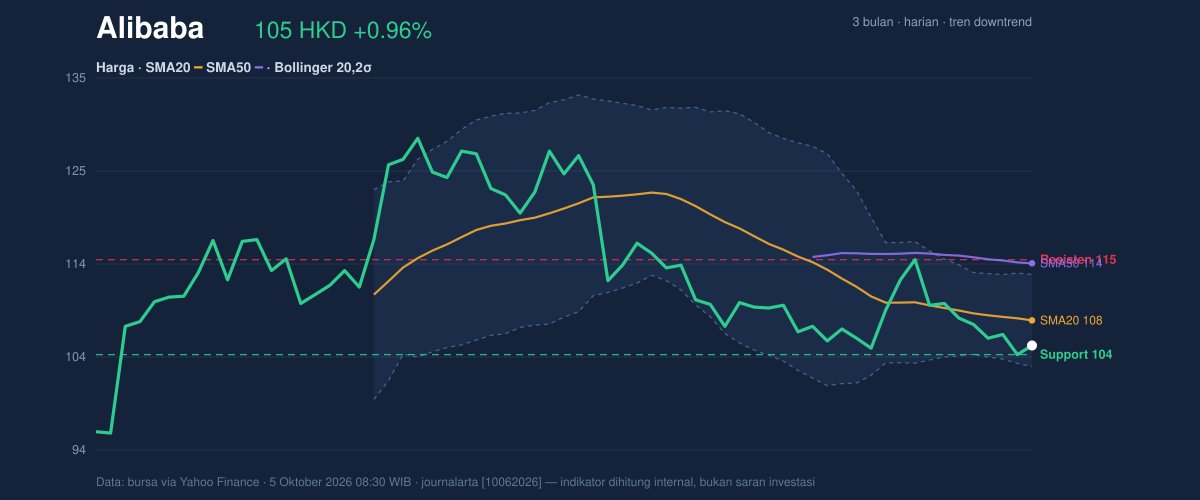
Alibaba Group rose 0.96% to HK$105.40 in Hong Kong trading, but the gain came against a falling short-term trend, weak trading volume and negative MACD momentum. The latest price remains below both its 20-day and 50-day moving averages, suggesting the one-day rebound has yet to change the broader technical picture. Data are from the exchange via Yahoo Finance, as of 08:30 WIB on 5 October 2026.
Trend & Price Action
Alibaba’s shares have fallen 2.77% over five days and 4.27% over one month. The 20-day simple moving average, which smooths recent price changes, is HK$108.15 and slopes down 1.00% over five days; the 50-day average is higher, at HK$114.40. With the stock below both measures and no recent moving-average crossover, the prevailing signal remains downward rather than a confirmed reversal.
The stock trades near the bottom of its 20-session range: support is HK$104.40 and resistance is HK$114.80, putting the last price within roughly the lowest tenth of that span. It is also below the middle of its Bollinger band, a range derived from recent price volatility. Its position at 23% of the band’s width indicates closeness to the lower boundary, not proof that a rebound is due. As shown in the chart, the price is approaching the HK$103.10 lower band while remaining well beneath the moving averages.
Oscillators & Momentum
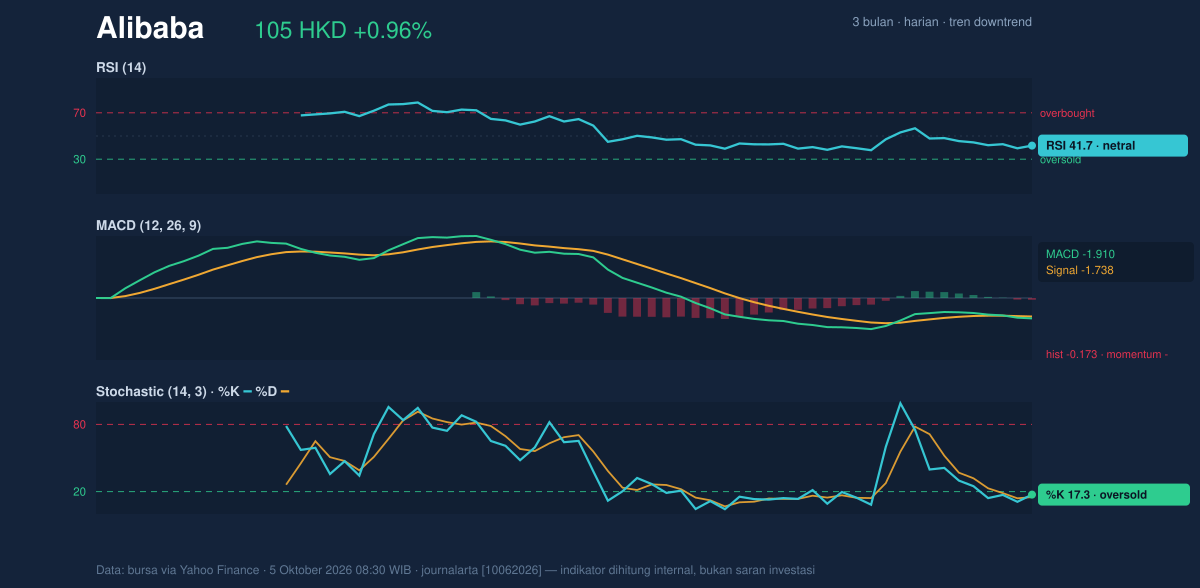
The indicators are mixed, but they do not yet confirm a turn higher. The Relative Strength Index (RSI), which gauges the pace of recent gains and losses, is 41.7, a neutral reading that is below the level associated with strong upward momentum. The Stochastic oscillator is more stretched: %K is 17.3 and %D is 15.1, both in oversold territory. That can signal that selling has been pronounced, but it is not, by itself, evidence that a recovery has begun.
MACD, a trend-and-momentum measure, remains negative at -1.910 against a signal line of -1.738, with a negative histogram of -0.173. The indicator therefore points to continuing downward momentum even as the Stochastic reading warns that the decline may be extended. The distinction matters: an oversold reading describes recent trading conditions, while confirmation of a reversal would require price and momentum to strengthen together. The chart shows the RSI, MACD and Stochastic readings side by side.
Volatility, Volume & Key Levels
The Bollinger band width is 9.3%, described as normal, so the data show neither an unusually tight squeeze nor a sharp volatility expansion. Average True Range (ATR), a measure of typical daily price movement, is HK$3.40, or 3.2% of the share price—consistent with moderate volatility. That makes the nearby support relevant, but it also means price can move meaningfully within ordinary trading conditions.
Participation in the rebound was limited. Latest volume of 24,811,599 shares was about half the 20-day average of 53,430,605. On-Balance Volume (OBV), which tracks whether volume tends to accompany rising or falling prices, is up; that offers a counterpoint to the subdued session volume, but does not erase the downtrend or negative MACD.
The first test is support at HK$104.40. If price breaks below that level, attention shifts to the lower Bollinger band at HK$103.10; a failure there would weaken the case that the current decline is merely pausing. If support holds and the stock climbs, the 20-day average at HK$108.15 is an initial hurdle, followed by resistance at HK$114.80. The three-month range, HK$92.50 to HK$130.30, shows how far price has retreated from its recent high, but does not establish that either extreme will be revisited.
Technical Verdict: HOLD (wait & see)
HOLD (wait & see) best reflects the split signals: price remains below falling short-term and higher-timeframe averages; MACD is negative; and low session volume offers little confirmation of the rebound. Oversold Stochastic readings and rising OBV keep a recovery scenario in view, but neither confirms it. The verdict is invalidated if price falls below HK$104.40 support.
- Ideal Entry Range: HK$104.40–HK$108.15, framed by 20-session support and the 20-day average.
- Exit Target (Target Price): HK$114.80, the stated 20-session resistance.
- Stop Loss protection: HK$103.10, the lower Bollinger band; a move below it would show support has not held.
In plain English, the indicators show a weak trend with a possible short-term rebound, but no confirmed turn.
| Measure | Latest reading |
|---|---|
| Last price | HK$105.40 |
| Daily change | +0.96% |
| Five-day / one-month change | -2.77% / -4.27% |
| SMA20 / SMA50 | HK$108.15 / HK$114.40 |
| Bollinger bands (upper / middle / lower) | HK$113.19 / HK$108.15 / HK$103.10 |
| RSI / Stochastic %K and %D | 41.7 / 17.3 and 15.1 |
| MACD / signal / histogram | -1.910 / -1.738 / -0.173 |
| ATR / volume vs. 20-day average | HK$3.40 / 0.5× |
| 20-session support / resistance | HK$104.40 / HK$114.80 |
| Three-month high / low | HK$130.30 / HK$92.50 |
Summary Data Alibaba
| Last price | 105.40 HKD |
| Change 1 day / 5 days / 1 month | 0.96% / -2.77% / -4.27% |
| Trend / MA-cross | downtrend / none |
| SMA20 / SMA50 | 108.15 / 114.40 |
| RSI (14) / Stochastic %K | 41.7 / 17.3 |
| Bollinger %B / ATR | 23% / 3.40 |
| Support / Resistance 20 days | 104.40 / 114.80 |
| Data as of | 5 Oktober 2026 08:30 WIB |
Track Alibaba share price daily: live levels, support/resistance and our full Alibaba analysis history.