RSI Oversold, HSBC Stock Gains 0.27% Today
On Oktober 6, 2026: price 149.90 HKD, trend downtrend, RSI 29.9, support 149.50, resistance 167.60. technical analysis of hsbc stock. RSI Oversold — full…
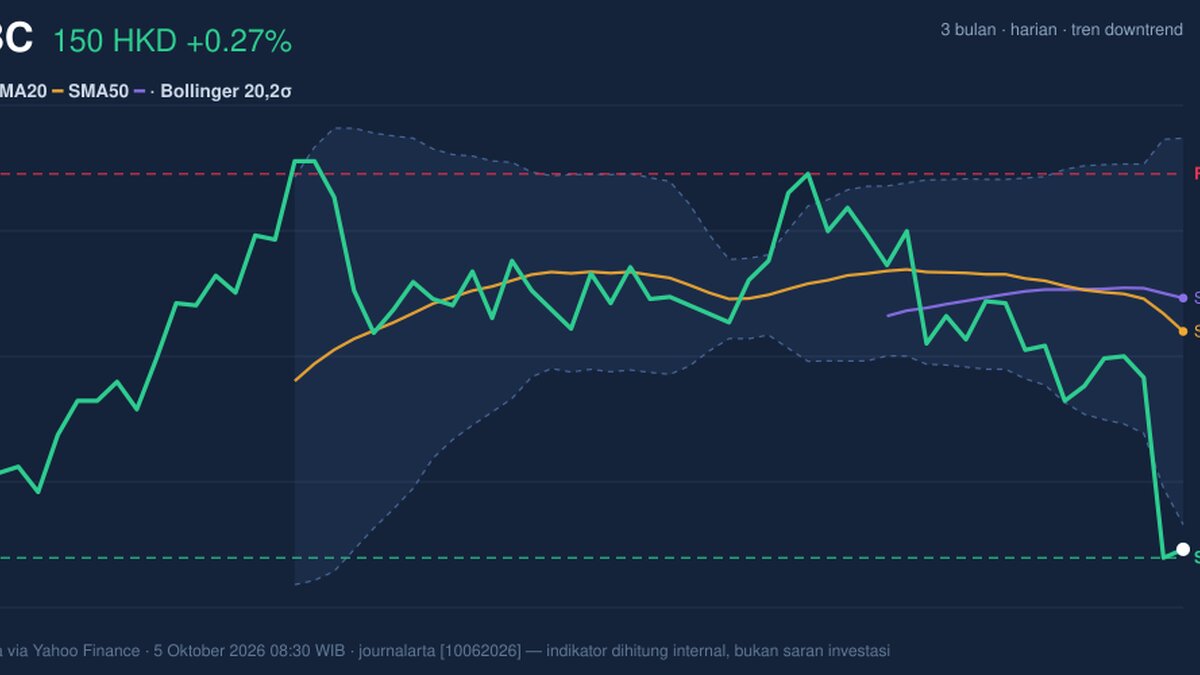
HSBC’s Hong Kong-listed shares were at HK$149.90 as of October 5, up 0.27% on the day but down 4.89% over five sessions and 10.08% in a month. The small daily gain has not reversed the broader decline: the price sits below both its 20-day and 50-day averages, while momentum and trading-volume indicators remain weak.
Trend & Price Action
The shares are below the 20-day simple moving average (SMA) of HK$160.17 and the 50-day SMA of HK$161.74. The 20-day average is also sloping downward, at 1.21% over five days. That combination points to persistent selling pressure rather than a brief pullback within a rising trend. There has been no new moving-average crossover, so the averages do not yet signal a fresh change in direction.
Price is near the bottom of its recent range: the 20-day support is HK$149.50, while resistance is HK$167.60. The three-month high and low are HK$169.70 and HK$147.60, respectively. Being only around 2% into the stated range from its lower end leaves little distance to nearby support. A hold there could steady the decline; a break below it would put the three-month low in focus.
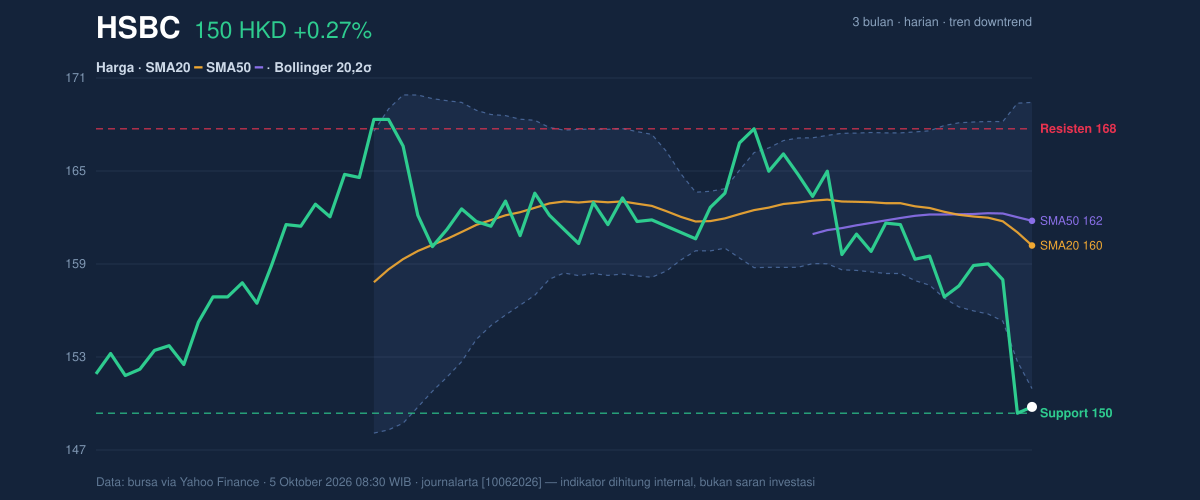
The lower Bollinger Band is at HK$151.06, above the current price, and the band reading of -6% places the shares outside the usual band range. This can reflect unusually stretched downside pressure, but it does not by itself confirm a reversal. The bands’ 11.4% width is described as normal, so the data do not indicate an exceptional volatility squeeze or expansion.
Oscillators & Momentum
The RSI is 29.9, in oversold territory, while the Stochastic readings are 13.9 and 14.3, also oversold. These measures indicate that the recent decline has been sharp relative to recent trading activity. They can precede a pause or rebound, but oversold readings are not a timing signal on their own—and the trend remains downward.
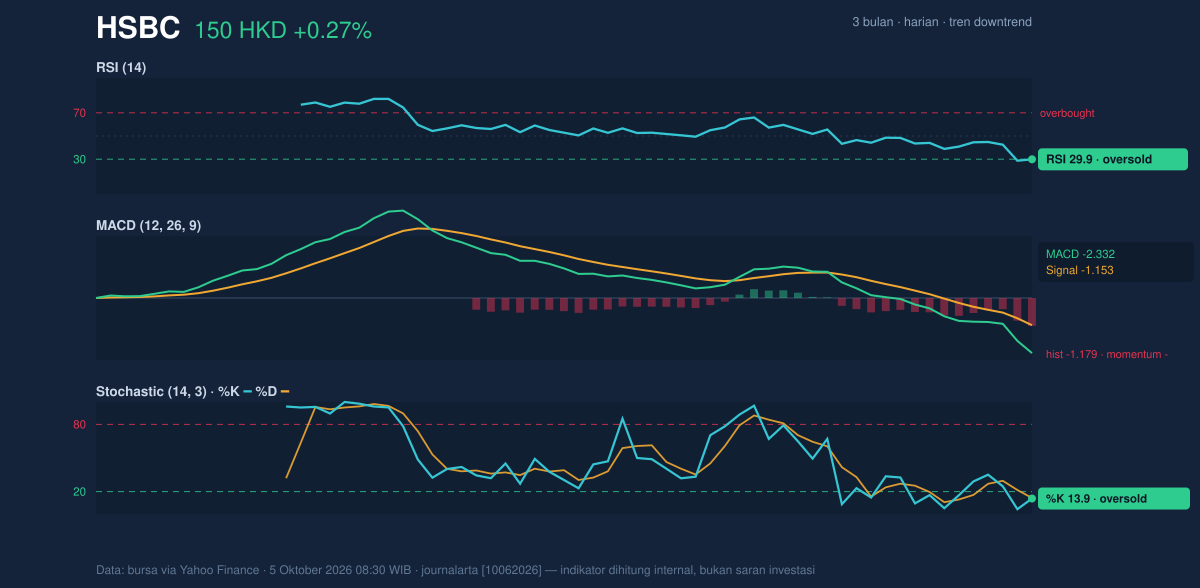
The MACD is negative at -2.332, below its -1.153 signal line, with a negative histogram of -1.179. That alignment shows downside momentum is still prevailing, limiting the case for treating oversold conditions as evidence that a durable low is in place.
Volatility, Volume & Levels
Average True Range (ATR), a measure of typical price movement, is HK$3.29, or 2.2% of the share price—moderate volatility by the supplied data. Volume reached 11.89 million shares, about 1.2 times the 20-day average. Higher-than-normal activity alongside a falling On-Balance Volume (OBV) reading suggests selling participation has not clearly dried up.
HK$149.50 is the immediate support to watch; below it, the three-month low stands at HK$147.60. On a recovery, the lower Bollinger Band at HK$151.06 is the first nearby reference, followed by the 20-day average at HK$160.17. Resistance at HK$167.60 remains a more substantial hurdle. A sustained move above the moving averages would improve the technical picture; failure at support would reinforce the existing downtrend.
Technical Verdict: HOLD (wait & see)
The technical verdict is HOLD (wait & see): oversold RSI and Stochastic readings raise the possibility of a pause, but the downward-sloping 20-day average, negative MACD and falling OBV show that weakness remains unconfirmed as a reversal. The verdict is invalidated if price falls below HK$149.50.
- Illustrative entry range: HK$149.50–HK$151.06, bounded by near-term support and the lower Bollinger Band.
- Illustrative exit target: HK$160.17, the 20-day average, with HK$167.60 as the next resistance reference.
- Illustrative stop-loss protection: HK$147.60, the three-month low.
In plain English, the shares are stretched lower, but the indicators do not yet show that selling has ended.
Technical analysis only; not an investment recommendation.
Source: Hong Kong exchange data via Yahoo Finance, as of October 5, 2026, 08:30 WIB.
Summary Data HSBC
| Last price | 149.90 HKD |
| Change 1 day / 5 days / 1 month | 0.27% / -4.89% / -10.08% |
| Trend / MA-cross | downtrend / none |
| SMA20 / SMA50 | 160.17 / 161.74 |
| RSI (14) / Stochastic %K | 29.9 / 13.9 |
| Bollinger %B / ATR | -6% / 3.29 |
| Support / Resistance 20 days | 149.50 / 167.60 |
| Data as of | 5 Oktober 2026 08:30 WIB |
Track HSBC share price daily: live levels, support/resistance and our full HSBC analysis history.