Keppel Stock Drops 2.32% on Thursday, RSI Oversold
On October 15, 2026: price 10.12 SGD, trend downtrend, RSI 22.9, support 10.12, resistance 11.47. technical analysis of keppel stock. Keppel Stock Drops — full…
Trend & Price Action
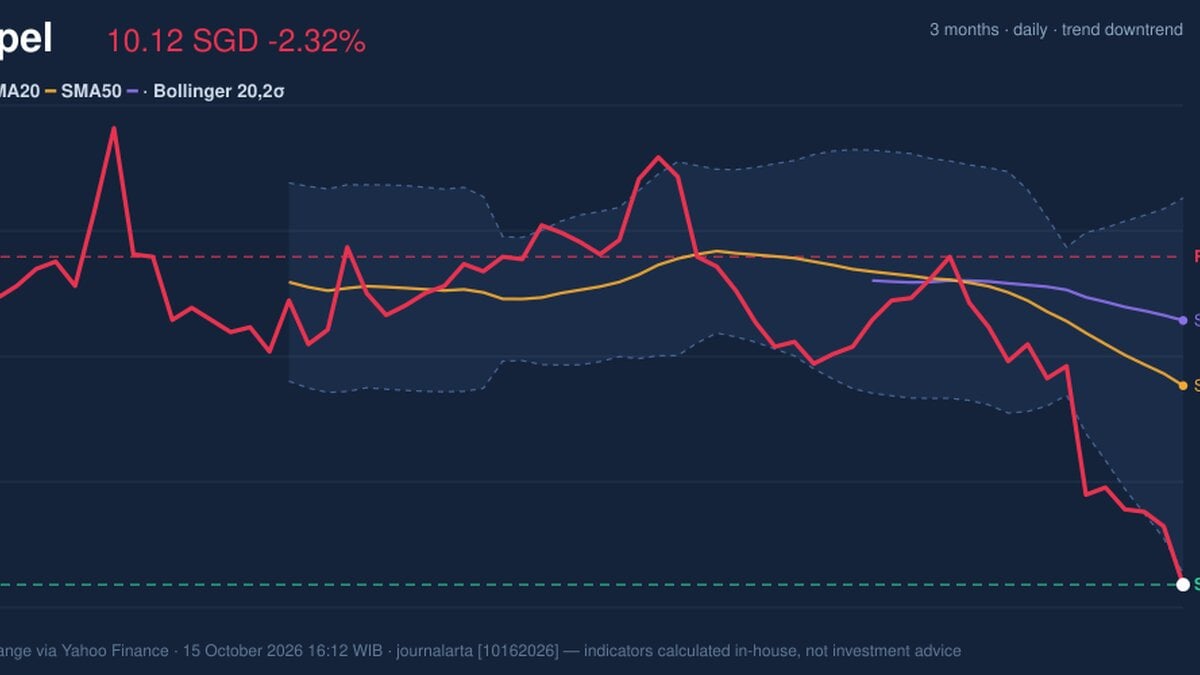
The latest price is below both the 20-day moving average (SMA20) of S$10.94 and the 50-day average (SMA50) of S$11.21. The SMA20 is sloping down, falling 1.94% over five trading days. That combination points to a weakening short-term trend, while the absence of a recent moving-average crossover offers no technical sign that the trend has turned. Keppel is at the bottom of its 20-day range, with support at S$10.12 and resistance at S$11.47. The three-month low of S$10.07 is just below the latest close, making that area an immediate test for sellers and buyers. A sustained move above the SMA20 would be an early sign of improving price structure; until then, the falling averages remain overhead obstacles. The S$10.12 close is pressing against support, not confirming a rebound.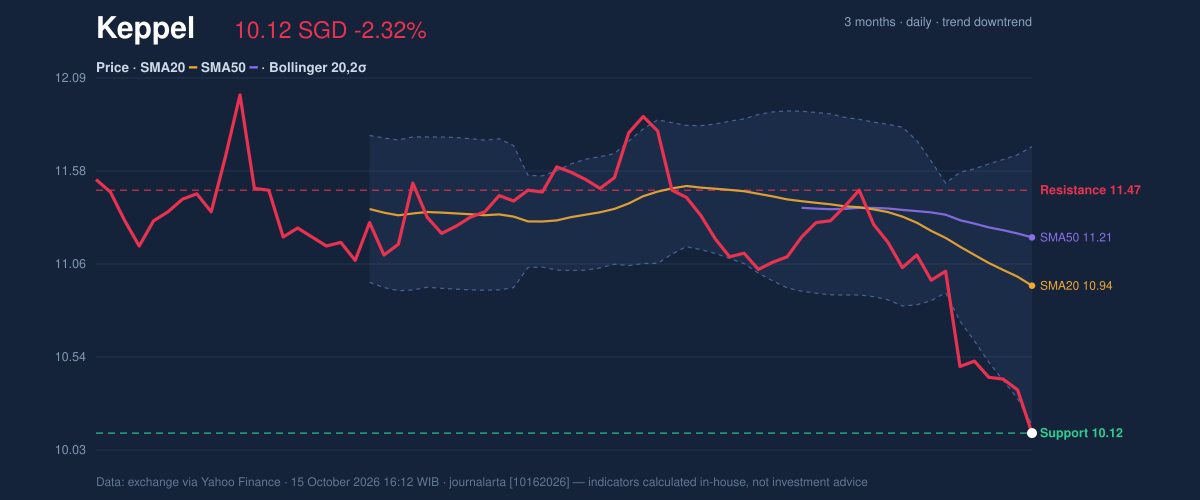
Oscillators & Momentum
The 14-day RSI is 22.9, while the Stochastic readings are 3.4 for %K and 3.7 for %D. Both measures are in oversold territory, meaning the recent fall has been unusually persistent relative to recent trading. Such readings can precede a bounce, but they are not a timing signal on their own: a share can remain oversold while its price continues to decline. RSI at 22.9 and Stochastic at 3.4/3.7 are oversold, but not yet evidence of a reversal. The MACD is also negative at -0.273, below its -0.180 signal line, with a negative histogram of -0.093. In plain terms, downward momentum is still stronger than any emerging upward push. The readings therefore show tension in the setup: selling may be stretched, but the trend has not yet supplied confirmation of a recovery.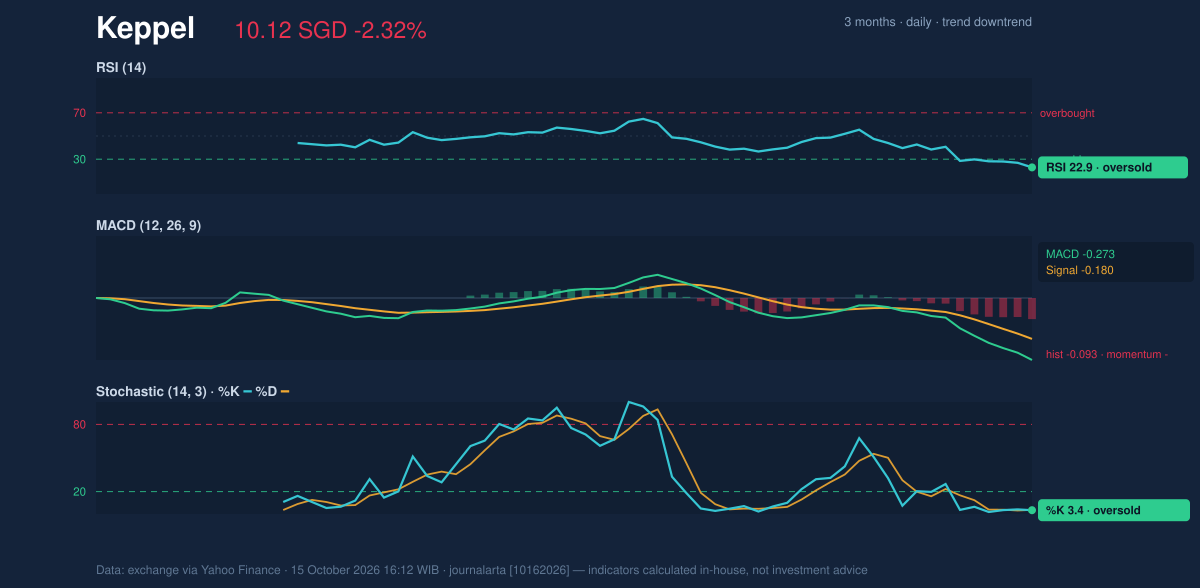
Volatility & Volume
Keppel’s price is 3% below the lower Bollinger Band, whose level is S$10.17. Bollinger Bands track a range around a moving average; a close beneath the lower band signals that the share has moved beyond its recent typical range. The band width is 14.1%, described as normal, so the data do not indicate an unusually compressed setup that might foreshadow a sharp move. The average true range is S$0.23, or 2.2% of the share price, pointing to moderate daily volatility. That matters around the current support: price swings of this scale can test nearby levels, and a brief move below support would need to be judged against whether the price can recover, rather than treated automatically as a lasting break. Volume was 5,506,790 shares, about 1.2 times the 20-day average of 4,427,449. Higher-than-usual turnover alongside a falling price suggests the decline has drawn more participation, not simply occurred on thin trading. OBV, a measure that tracks the flow of volume with price direction, is also falling, reinforcing the lack of accumulation evidence.Key Levels & Scenarios
Support sits at S$10.12, with the three-month low at S$10.07. A break below that area would put the stock beneath both the 20-day support reference and its recent low, weakening the case that the oversold readings are producing a floor. If support holds, a recovery would first face the lower Bollinger Band at S$10.17, then the SMA20 at S$10.94. The 20-day resistance at S$11.47 is a further hurdle; reaching it would require a meaningful improvement from the current price.Technical Verdict: HOLD (wait & see)
The technical picture supports a wait-and-see verdict: oversold readings raise the possibility of a rebound, but the falling trend and negative momentum have not confirmed one. The strongest signals are the price below declining moving averages, MACD below its signal line, and rising volume on a down day. - Ideal Entry Range: S$10.12–S$10.17, the current support and lower Bollinger Band area, conditional on that zone holding. - Exit Target (Target Price): S$10.94–S$11.47, spanning the SMA20 and 20-day resistance. - Stop Loss protection: Below S$10.07, the three-month low and the level that would invalidate the support-hold scenario. The verdict is invalidated if the price falls below S$10.07. For non-traders, this means Keppel looks stretched after its decline, but the chart has not yet shown that selling is over.Market data: SGX via Yahoo Finance, as of 15 October 2026, 16:12 WIB. Technical analysis is not an investment recommendation.
Why Keppel is in focus today
- Trading near its 3-month low (10.07)
- RSI(14) at 22.9 — oversold zone
- Downtrend extending (5-day change -3.53%)
Selected automatically from 16 SGX (Singapore) stocks by a technical-signal score with daily weighted randomisation — not a recommendation.
Summary Data Keppel
| Last price | 10.12 SGD |
| Change 1 day / 5 days / 1 month | -2.32% / -3.53% / -8.99% |
| Trend / MA-cross | downtrend / none |
| SMA20 / SMA50 | 10.94 / 11.21 |
| RSI (14) / Stochastic %K | 22.9 / 3.4 |
| Bollinger %B / ATR | -3% / 0.23 |
| Support / Resistance 20 days | 10.12 / 11.47 |
| Data as of | 15 October 2026 16:12 WIB |
Disclaimer: This technical analysis is generated automatically from exchange data (via Yahoo Finance) and indicators calculated by JournalArta, for information and education only. The verdict and the entry, target and stop-loss levels are not investment advice or a solicitation to buy or sell any security. Investment decisions and their risks rest solely with the reader.
Track Keppel share price daily: live levels, support/resistance and our full Keppel analysis history.