Yangzijiang Stock Drops 2.33% on Thursday, Momentum Weakens
On October 15, 2026: price 5.03 SGD, trend sideways, RSI 50.3, support 4.94, resistance 5.26. technical analysis of yangzijiang stock. Yangzijiang Stock Drops…
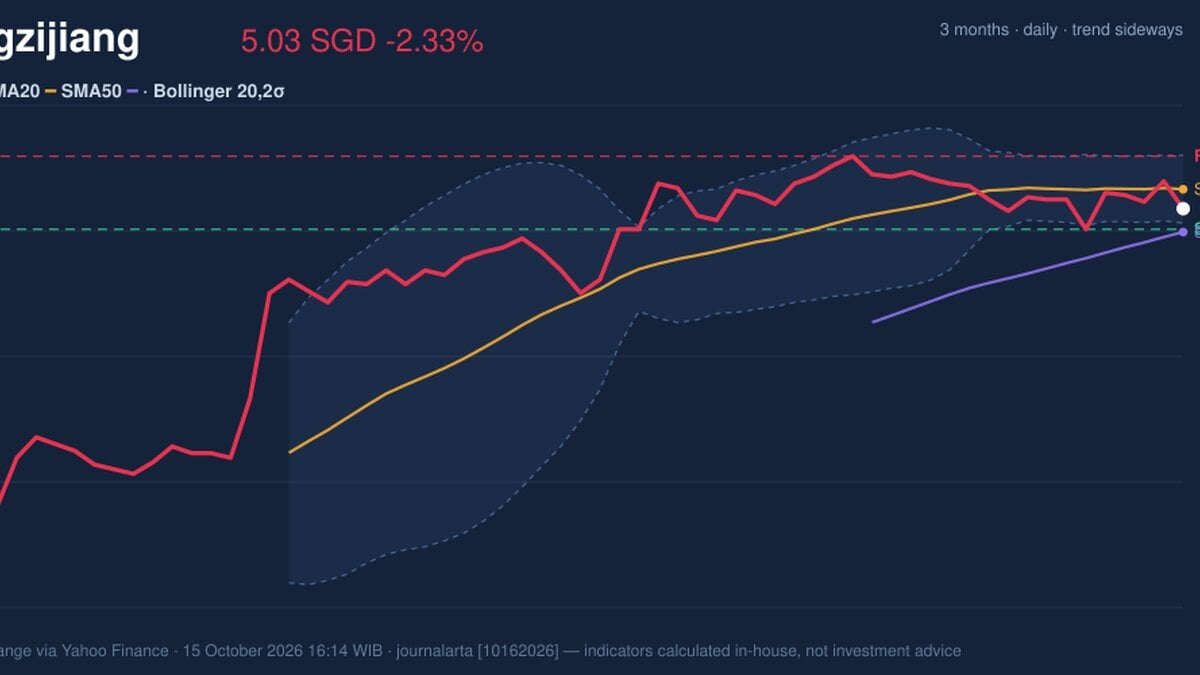
Yangzijiang Shipbuilding fell 2.33% to SGD 5.03 on October 15, despite trading volume running 1.5 times its 20-day average. The stock has not been covered by JournalArta in the past 14 days; the sharp price-volume contrast makes its technical signals worth examining. The picture is mixed.
Trend & Price Action
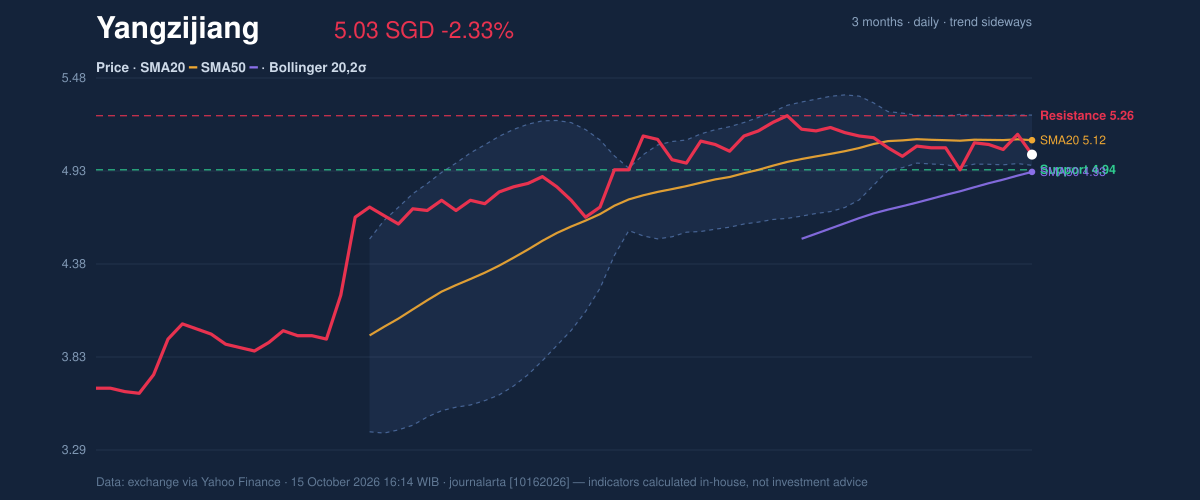
The decline left the share price below its 20-day simple moving average (SMA20) of SGD 5.12, but still above its 50-day average of SGD 4.93. The SMA20’s slope is slightly positive, while the broader trend is classified as sideways and no new moving-average crossover has formed. That combination suggests neither a clear recovery nor a confirmed breakdown: the short-term price is soft, but the longer average has not yet been lost.
At 28% of its 20-trading-day range, the stock is closer to support at SGD 4.94 than resistance at SGD 5.26. Its three-month range runs from SGD 3.52 to SGD 5.41, placing the current price well above the period low but below the high. The upper end of the shorter range also matches the upper Bollinger Band, making SGD 5.26 a notable test for any rebound.
Oscillators & Momentum
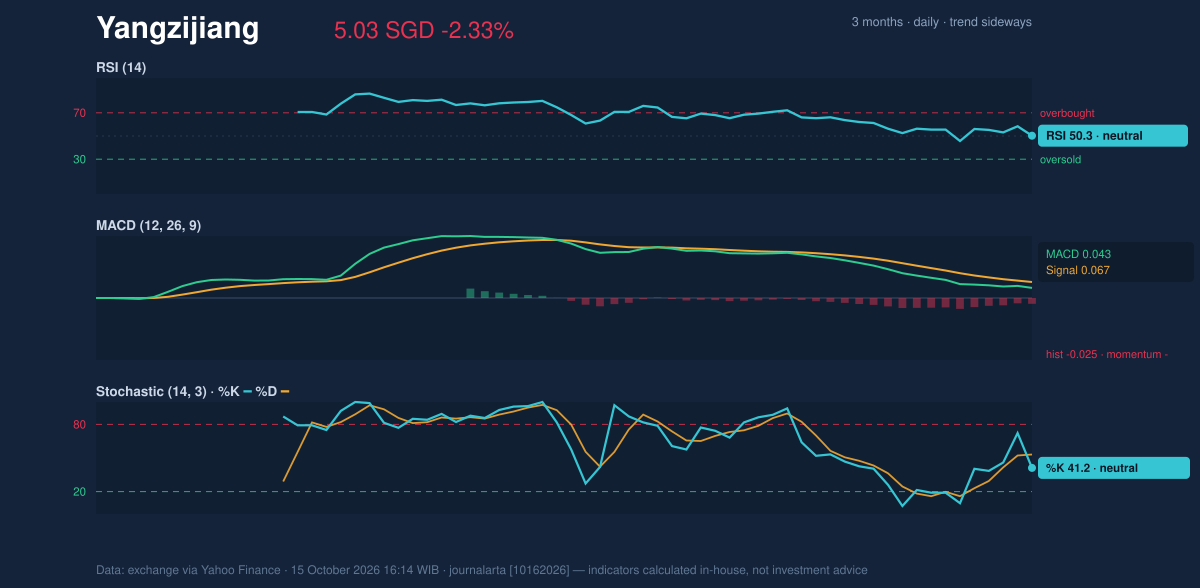
The momentum indicators do not yet confirm a decisive move in either direction. RSI at 50.3 is neutral, indicating that recent gains and losses are broadly balanced rather than showing an extreme condition. Stochastic %K at 41.2 and %D at 53.1 are also neutral; with %K below %D, the faster measure is weaker, but the readings do not point to an oversold market.
MACD is the more cautionary signal: its reading of 0.043 is below the 0.067 signal line, and the histogram is negative at -0.025. In plain terms, the underlying trend measure remains above zero, but its recent momentum has weakened. That fits the session’s fall and the price’s position below its SMA20, without establishing a sustained downward trend on its own.
Volatility & Volume
The Bollinger Bands are narrowing: their width is 5.8%, with price at 21% of the band range. A squeeze means recent price variation has contracted; it can precede a larger move, but does not predict whether that move will be up or down. The share is near the lower band at SGD 4.97, which may act as a reference point in the near term, while the middle band at SGD 5.12 aligns with the SMA20.
Average true range, a measure of typical daily price movement, is SGD 0.13, or 2.5% of the share price—moderate volatility by this data set. Volume reached 20,269,500 shares against a 20-day average of 13,834,970. Higher turnover alongside a falling price can signal active selling, and the declining OBV (on-balance volume, which tracks whether trading volume accumulates on up or down sessions) offers no confirmation that buyers are absorbing that pressure.
Key Levels & Scenarios
A hold above SGD 4.94 support would keep the share within its recent range and leave room for a test of the SMA20 at SGD 5.12. A move through that average would be an early sign of improvement, but resistance at SGD 5.26 remains the more significant ceiling in the supplied data. Conversely, a break below SGD 4.94 would weaken the range-bound case. The narrowing bands make a larger move possible, while the negative MACD histogram and falling OBV leave its direction unresolved.
Technical Verdict: HOLD (wait & see)
HOLD (wait & see) is the clearest reading of the conflicting evidence: RSI and Stochastic are neutral; price remains above the SMA50 despite sitting below the SMA20; and negative MACD momentum alongside falling OBV argues against treating the day’s heavy turnover as confirmed accumulation. The verdict is invalidated if the price falls below SGD 4.94 support.
- Indicative entry range: SGD 4.97–5.12, bounded by the lower Bollinger Band and the SMA20, as a technical reference rather than a recommendation.
- Exit target: SGD 5.26, the 20-day resistance and upper Bollinger Band.
- Stop-loss reference: Below SGD 4.94, the 20-day support level.
For non-traders, the chart points to a share trading without a clear trend, with its next signal likely to come from whether support holds or resistance gives way.
Market data: Singapore Exchange via Yahoo Finance, as of October 15, 2026, 16:14 WIB.
Summary Data Yangzijiang
| Last price | 5.03 SGD |
| Change 1 day / 5 days / 1 month | -2.33% / 1.82% / -2.14% |
| Trend / MA-cross | sideways / none |
| SMA20 / SMA50 | 5.12 / 4.93 |
| RSI (14) / Stochastic %K | 50.3 / 41.2 |
| Bollinger %B / ATR | 21% / 0.13 |
| Support / Resistance 20 days | 4.94 / 5.26 |
| Data as of | 15 October 2026 16:14 WIB |
Disclaimer: This technical analysis is generated automatically from exchange data (via Yahoo Finance) and indicators calculated by JournalArta, for information and education only. The verdict and the entry, target and stop-loss levels are not investment advice or a solicitation to buy or sell any security. Investment decisions and their risks rest solely with the reader.
Track Yangzijiang share price daily: live levels, support/resistance and our full Yangzijiang analysis history.