RSI Oversold, Barclays Stock Drops 3.50% on Monday
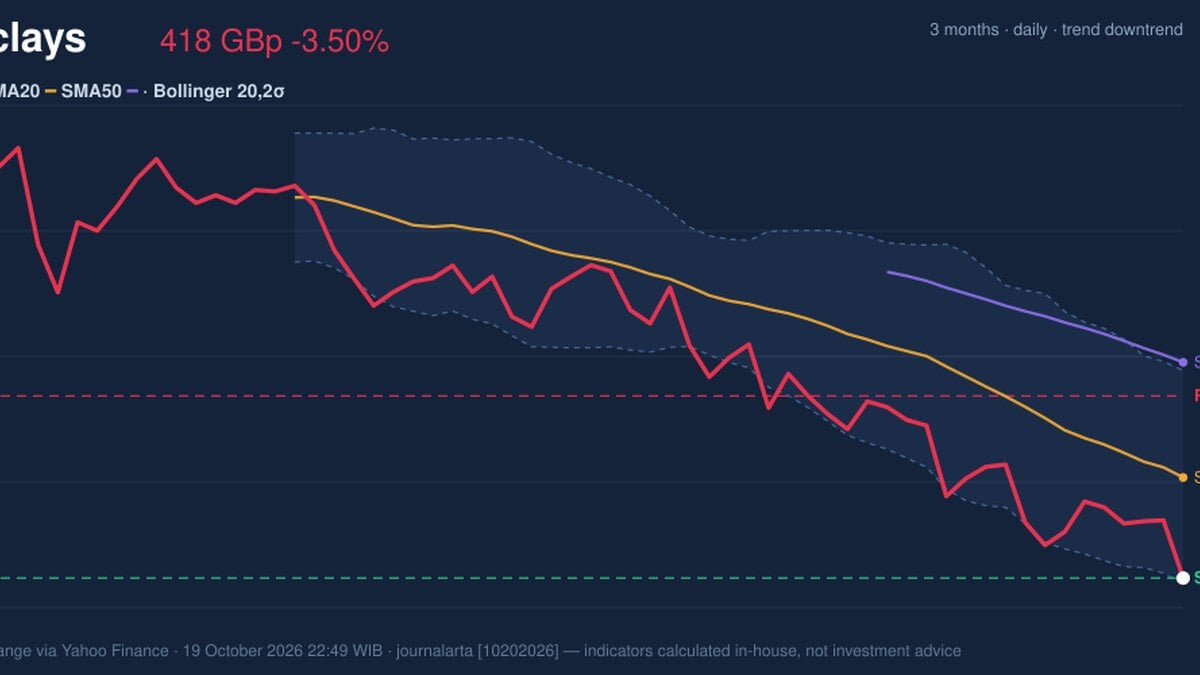
On October 19, 2026: price 417.50 GBp, trend downtrend, RSI 28.7, support 417.50, resistance 465.30. technical analysis of barclays stock.
Why Barclays is in focus today
- Closed at a 20-day low (417.50)
- RSI(14) at 28.7 — oversold zone
- MACD histogram has just turned negative
- Downtrend extending (5-day change -4.59%)
Selected automatically from 16 LSE (UK) stocks by a technical-signal score with daily weighted randomisation — not a recommendation.
Trend & Price Action
The broader technical picture remains weak. Barclays has fallen 11.38% over the past month and trades below both its 20-day simple moving average (SMA), at 443.88 GBp, and its 50-day SMA, at 474.15 GBp. A simple moving average smooths recent prices; when the share price sits beneath both averages, it signals that the prevailing trend is down. The 20-day average is also declining, by 2.28% over five days. There has been no new crossover between the averages to suggest a change in trend. The share is resting at the lower edge of its 20-day range, with support at 417.50 GBp and resistance at 465.30 GBp. That leaves little room for further weakness before the current support is tested, but a level is not a floor: a decisive break below it would undermine the case for a near-term rebound. The three-month high is 538.30 GBp; the supplied data report the three-month low as 0.00 GBp, which is not a useful market reference. The chart makes the pressure visible.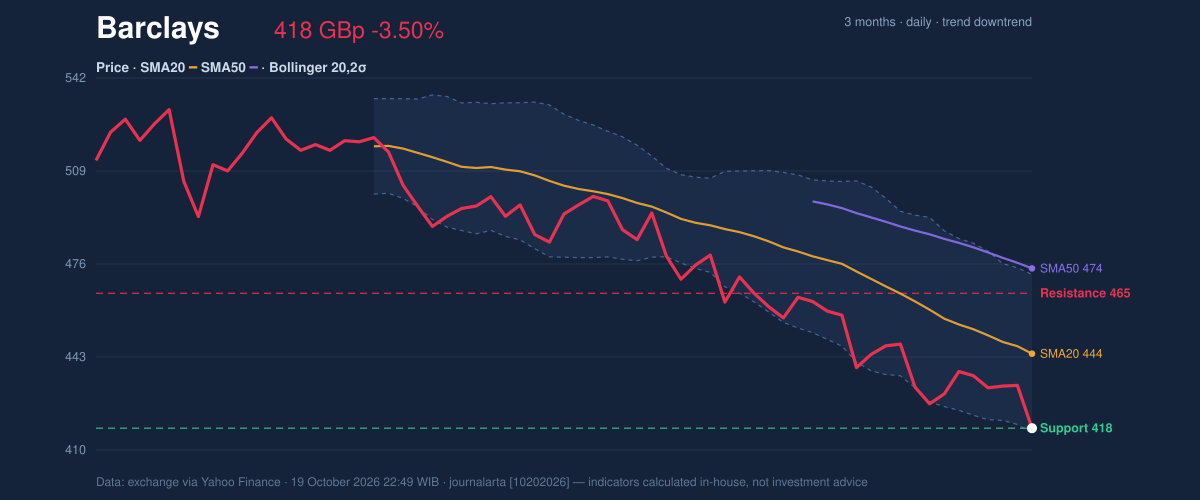
Oscillators & Momentum
The RSI, or relative strength index, is 28.7, below the commonly watched 30 threshold and therefore in oversold territory. That means recent losses have been unusually persistent; it does not mean the decline must end. The Stochastic readings pull in the other direction: %K at 83.0 is overbought, while %D is 37.4. This divergence between a deeply weak RSI and a high short-term Stochastic reading suggests a possible bounce may be uneven rather than a clean trend reversal. MACD momentum is also negative. The MACD line is -13.922, below its signal line at -13.608, and the histogram has turned negative at -0.314. The histogram measures the gap between those lines; its move below zero indicates that downside momentum has recently strengthened. That signal matters because oversold conditions can persist when the underlying trend is still falling. The momentum chart shows the indicators’ competing messages.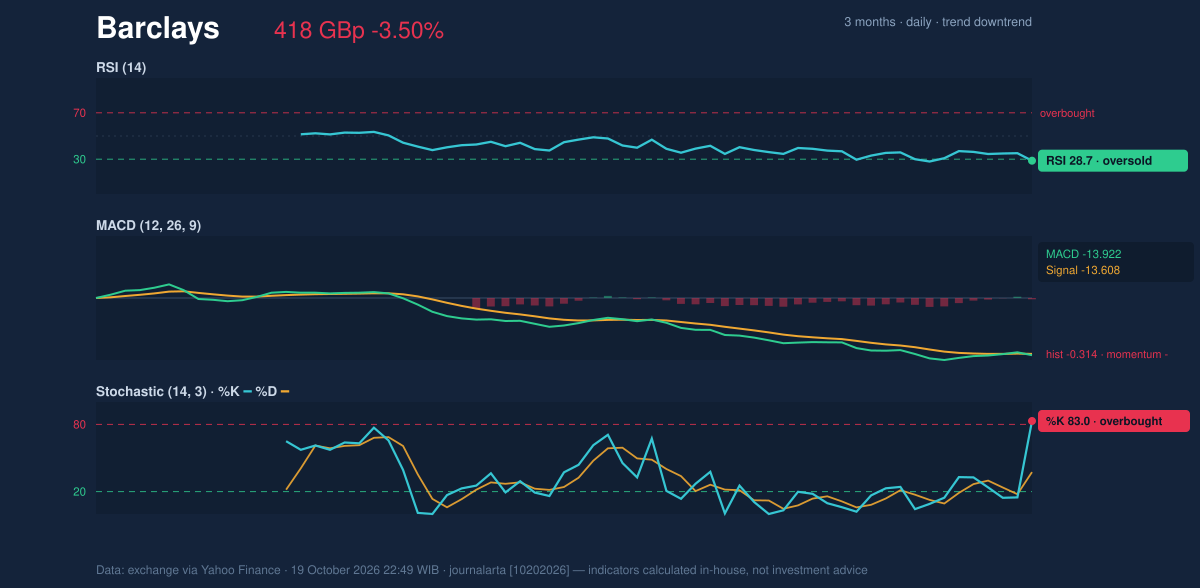
Volatility & Volume
Barclays is moving in a wide but not unusually expanding Bollinger band. The bands, which map price movement around a moving average, span 415.75–472.02 GBp; the share’s position at 3% of the band places it close to the lower edge. The band width is 12.7%, classified as normal, so the data do not show a squeeze that might foreshadow a sharp volatility breakout. Volatility itself is high: the average true range (ATR) is 45.92 GBp, or 11.0% of the share price. ATR estimates typical trading movement, not direction, and this reading means support and resistance may be tested with sizeable swings. Trading volume was 65,070 shares against a 20-day average of 38,258,637, recorded as thin volume in the supplied data. That weak participation makes it harder to treat the session’s move as a definitive market-wide signal. On-balance volume (OBV), a running measure that adds or subtracts volume according to price direction, is rising—an offsetting sign, though thin volume limits its weight.Key Levels & Scenarios
Holding 417.50 GBp would preserve the current 20-day support and leave room for an attempt to recover toward the declining 443.88 GBp SMA20. A sustained move through that average would be a more meaningful improvement than an oversold reading alone; the next stated resistance is 465.30 GBp. If support gives way, the current data provide no lower support level, so the risk is that price discovery continues below the observed range.Technical Verdict: HOLD
The technical verdict is HOLD (wait & see). The oversold RSI and rising OBV offer tentative counter-signals, but the price remains below both moving averages, while the negative MACD histogram and falling trend point to unresolved downside pressure. The verdict is invalidated if price falls below 417.50 GBp.- Ideal entry range: 417.50–443.88 GBp, based on current support and the SMA20; this is a technical reference range, not a forecast.
- Exit target: 465.30 GBp, the stated 20-day resistance.
- Stop-loss protection: Below 417.50 GBp, the stated 20-day support.
Summary Data Barclays
| Last price | 417.50 GBp |
| Change 1 day / 5 days / 1 month | -3.50% / -4.59% / -11.38% |
| Trend / MA-cross | downtrend / none |
| SMA20 / SMA50 | 443.88 / 474.15 |
| RSI (14) / Stochastic %K | 28.7 / 83.0 |
| Bollinger %B / ATR | 3% / 45.92 |
| Support / Resistance 20 days | 417.50 / 465.30 |
| Data as of | 19 October 2026 22:49 WIB |
Disclaimer: This technical analysis is generated automatically from exchange data (via Yahoo Finance) and indicators calculated by JournalArta, for information and education only. The verdict and the entry, target and stop-loss levels are not investment advice or a solicitation to buy or sell any security. Investment decisions and their risks rest solely with the reader.
Track Barclays share price daily: live levels, support/resistance and our full Barclays analysis history.