CSCO Stock Technicals Today: Gains 0.49%, Death Cross Pressure
On Juli 24, 2026: price 112.76 USD, trend downtrend, RSI 46.5, support 109.66, resistance 121.31. technical analysis of csco stock. CSCO Stock Technicals —…

Cisco Systems, Inc. (CSCO) last traded at 112.76 USD on Nasdaq, up 0.49% from the previous close, but the small rebound sits inside a broader slide. The stock is still trading below its short- and medium-term trend lines, and the chart shows a market that is trying to stabilize without yet proving that sellers have exhausted themselves.
Trend & Price Action
The first signal is the simplest: price remains below the SMA20 at 114.72 and well under the SMA50 at 117.33. That matters because moving averages often act like dynamic trend markers, and when price is below both, rallies tend to be treated as recovery attempts rather than trend reversals. The slope of the SMA20 at -1.69% over 5 days reinforces that point. It is still pointing down, which means the recent weakness is not just a one-day dip but part of a short-term deterioration.
The chart also shows a death cross, where the SMA20 has moved below the SMA50. That crossover is not magic, but it does tell investors that the faster trend has weakened enough to fall behind the slower one. In practical terms, it often signals that momentum traders and short-term trend followers are less likely to chase the stock until price can reclaim those averages. Cisco’s current position is also modestly repaired from the recent low: it is sitting at 27% of the 20-day range, with support at 109.66 and resistance at 121.31. That placement suggests the stock is closer to support than resistance, but not close enough to call the downtrend broken.
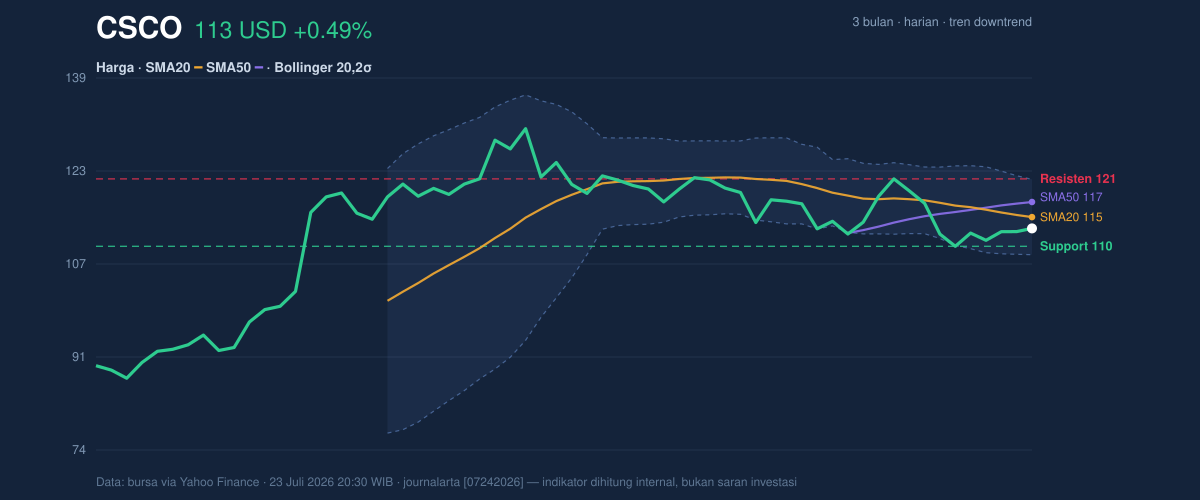
Cisco’s 1-month change of -5.82% confirms that the pressure has persisted beyond a single session. Yet the stock is still above its 3-month low of 85.78 and below its 3-month high of 130.37, leaving it in the middle of a wide range rather than at an extreme. That positioning matters because it leaves room for either a base-building phase or another leg lower, depending on whether support holds.
Oscillators & Momentum
The momentum picture is mixed, but not in a reassuring way. The RSI at 46.5 is neutral, which means the stock is neither stretched to the upside nor deeply oversold. In plain language, RSI is saying the market is undecided. That can be constructive if price is stabilizing near support, but it is not yet a bullish confirmation.
The Stochastic at 37.1 / 34.5 also sits in neutral territory. Stochastic compares where price is closing relative to its recent range, and these readings suggest Cisco is not showing strong upside urgency. As shown in the momentum chart, there is no clear oversold rebound signal, just a subdued setup that could improve if price begins to reclaim the mid-range.
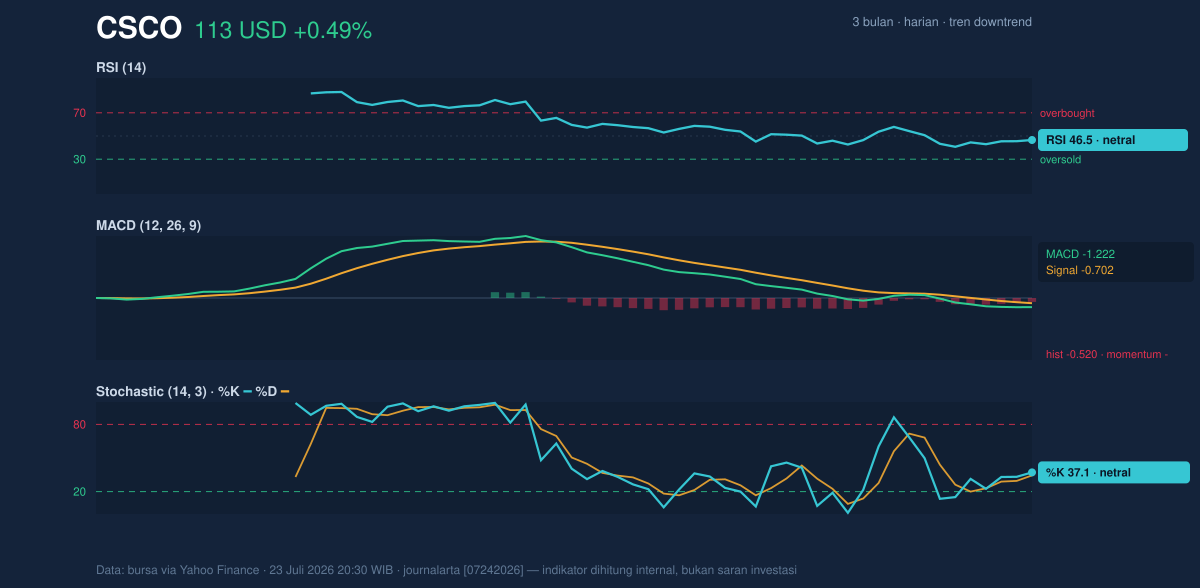
The more important warning comes from the MACD at -1.222, below the signal line at -0.702, with a histogram of -0.520. MACD is a trend-momentum measure, and when it stays below its signal line with a negative histogram, it means downside momentum is still dominating even if the pace of decline has slowed. That combination is why the recent bounce should be treated carefully: the stock has not yet generated the kind of momentum turn that usually accompanies a durable recovery.
Volatility & Volume
Volatility is present, but not extreme. Cisco’s ATR of 3.65, equal to 3.2% of price, indicates a market that can still move meaningfully in either direction over a short period. The Bollinger Bands help frame that risk. Price is near the lower half of the band structure, with the lower band at 108.21, the middle band at 114.72, and the upper band at 121.23. The %B at 35% shows the stock is closer to the lower band than the upper one, which often reflects a cautious market tone rather than strong accumulation.
The 11.3% Bollinger band width is described as normal, so this is not a squeeze suggesting an imminent volatility breakout. Instead, the bands imply a market that is still processing the downtrend without a dramatic compression or expansion signal. Volume adds another layer of skepticism. Last session’s 15,163,700 shares were only 0.6x normal versus the 20-day average of 23,692,785, and OBV is falling. That combination means the bounce is not being backed by broad participation. In technical terms, rising price on weak volume often lacks durability because it suggests fewer buyers are stepping in with conviction.
Key Levels & Scenarios
The nearest line in the sand is support at 109.66, just above the Bollinger lower band at 108.21. If Cisco loses that area, the chart would likely shift from a weak base attempt to a deeper retracement within the existing range. On the upside, resistance at 121.31 sits close to the Bollinger upper band at 121.23 and just above the SMA20 at 114.72, making the 114.72 area the first meaningful hurdle for any recovery attempt.
If price can reclaim the SMA20 at 114.72 and hold above it, the message would be that short-term selling pressure is easing. If it then pushes through 121.31, the chart would begin to shift from defensive to constructive. But until that happens, the structure still favors caution because the stock is below both moving averages, momentum is negative, and volume is not confirming the rebound.
Technical Verdict: HOLD (wait & see)
HOLD (wait & see)
- MACD remains negative and below its signal line, so downside momentum is still in place.
- Price is below SMA20 and SMA50, with a death cross confirming a weak trend structure.
- Volume is only 0.6x normal and OBV is falling, which weakens the case for a durable rebound.
Verdict invalidated if price falls below 109.66.
- Ideal Entry Range: 109.66 to 114.72
- Exit Target: 121.23 to 121.31
- Stop Loss protection: below 108.21
In plain English: Cisco is trying to stabilize, but the chart still needs stronger proof that buyers are back in control.
Nasdaq-listed Cisco last traded at 112.76 USD with support at 109.66 and resistance at 121.31.
Summary Data CSCO
| Last price | 112.76 USD |
| Change 1 day / 5 days / 1 month | 0.49% / 2.83% / -5.82% |
| Trend / MA-cross | downtrend / death |
| SMA20 / SMA50 | 114.72 / 117.33 |
| RSI (14) / Stochastic %K | 46.5 / 37.1 |
| Bollinger %B / ATR | 35% / 3.65 |
| Support / Resistance 20 days | 109.66 / 121.31 |
| Data as of | 23 Juli 2026 20:30 WIB |


