DIS Stock Technicals Today: Drops 1.73%, Momentum Weakens
On September 7, 2026: price 105.31 USD, trend sideways, RSI 50.6, support 103.18, resistance 111.25. technical analysis of dis stock. DIS Stock Technicals —…
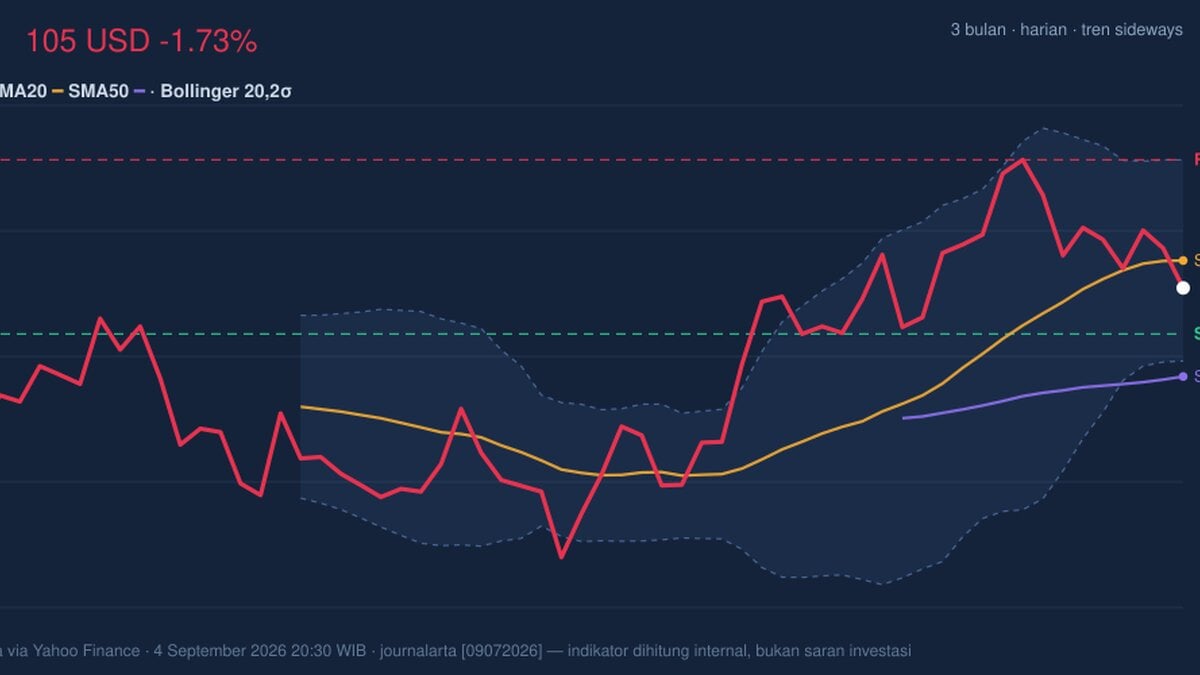
Walt Disney shares fell to 105.31 USD on 4 September 2026, slipping 1.73% from the previous close of 107.16 as the stock drifted back below its 20-day average at 106.58. That matters because a move under the short-term average often signals that recent buying pressure is fading, even though the broader setup is not broken: Disney still sits above its 50-day average at 101.21, keeping the medium-term structure intact. In plain terms, the stock is not in a clear downtrend, but it is also not showing the kind of momentum that would usually support a fresh advance.
Trend & Price Action
The chart shows a stock stuck in a sideways pattern, with the 20-day moving average rising 1.26% over 5 days but price failing to stay above it. That combination is important: a rising short-term average suggests the recent baseline is improving, yet the market is not confirming that with price. When price trades below the short-term average but above the longer one, it often means the stock is in a pause phase rather than a decisive trend. Disney’s position near the lower half of its recent range reinforces that reading, with the share price at about 26% of the 103.18 to 111.25 range and still below the 3-month high of 111.87.
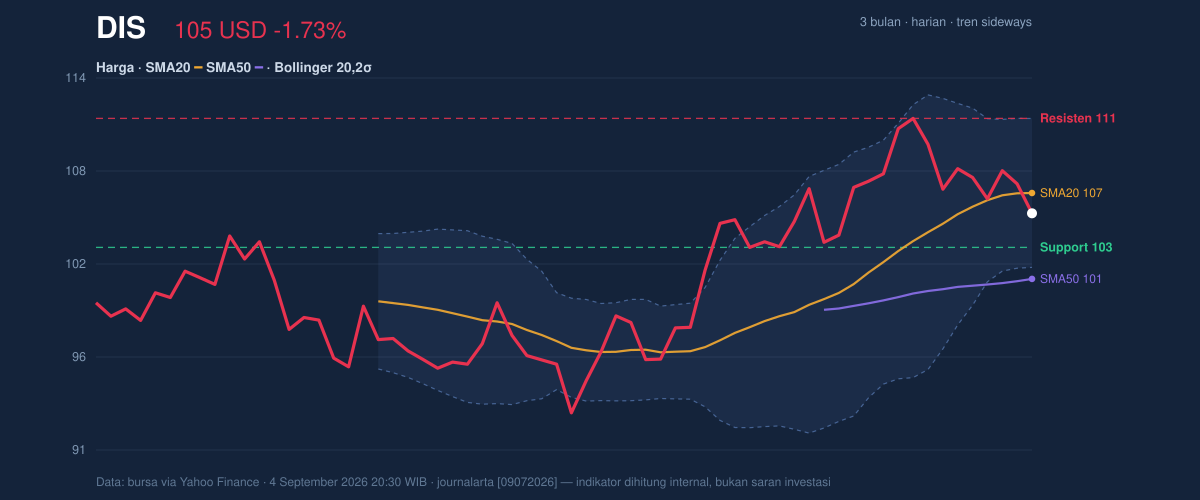
The Bollinger Bands add another layer: price is sitting below the middle band at 106.58, while the upper band at 111.25 and lower band at 101.92 frame the current battle zone. A %B reading of 36% means the stock is leaning toward the lower side of the band structure, but not in a stretched oversold condition. That is a subtle signal: the market is soft, yet not panicked. The 8.7% band width being normal suggests volatility is neither compressed into a breakout setup nor expanded into a disorderly move.
A short sentence captures it: Disney is drifting, not breaking.
Oscillators & Momentum
Momentum indicators are mixed, and that is the clearest reason the chart lacks conviction. The RSI at 50.6 is basically neutral, which means there is no strong overbought or oversold pressure forcing the stock one way or the other. But the Stochastic %K at 20.4 versus %D at 39.4 shows short-term momentum has weakened more sharply than the RSI suggests. In simple language, the stock has lost some near-term speed even though the broader momentum gauge has not turned bearish.
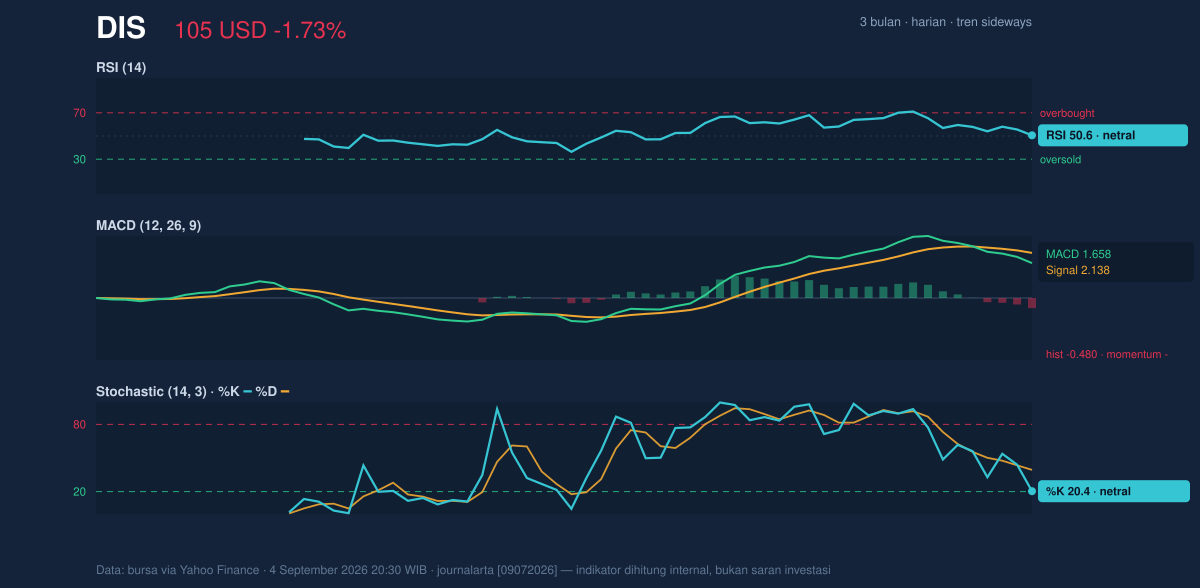
The more cautionary signal comes from MACD: 1.658 versus signal 2.138, with a -0.480 histogram. That negative histogram means the faster trend line has moved below the slower signal line, a classic sign that upward momentum is losing traction. It does not automatically mean a larger decline is underway, but it does tell readers that any rebound attempt will need fresh demand, not just a mechanical bounce. In other words, the momentum engine has cooled.
Volatility & Volume
Volatility is moderate, with ATR at 2.27, or about 2.2% of price. That is enough to allow meaningful daily swings, but not enough to imply a disorderly tape. The practical implication is that Disney can still test nearby support or resistance without needing a major catalyst. The issue is participation: last volume of 6,103,700 was only 0.8x the 20-day average of 7,590,470, while OBV is falling. On technical charts, volume and OBV are the market’s “proof of conviction.” When price slips and volume is lighter than normal, it often means sellers are not forcing a capitulation move — but the falling OBV shows that, over time, more shares are being distributed than accumulated.
That is the key tension in Disney right now.
Key Levels & Scenarios
The nearest support sits at 103.18, and that level matters because it is the lower edge of the recent trading box. If that floor holds, the stock can continue to oscillate inside the current range and potentially retest the 106.58 middle band first, then the 111.25 resistance zone. A move through 111.25 would matter because it would not just clear resistance; it would also reclaim the upper Bollinger band and suggest the stock is re-entering a stronger momentum phase.
If support at 103.18 gives way, the chart would point toward the 101.92 lower Bollinger band and then the 101.21 50-day average, which is the more important medium-term reference. A break below that area would weaken the current sideways structure and raise the risk that the recent range is resolving lower. For now, though, the stock is still perched above that longer average, so the chart remains in a watch-and-wait phase rather than a confirmed breakdown.
Technical Verdict: HOLD (wait & see)
HOLD (wait & see)
- RSI at 50.6 is neutral, so there is no strong directional edge from momentum.
- MACD histogram at -0.480 is negative, showing short-term momentum has slipped below its signal.
- Price is below the 20-day average at 106.58 but still above the 50-day average at 101.21, which is a mixed trend signal rather than a clean buy or sell setup.
Verdict invalidated if price breaks below 103.18, because that would weaken the current range and bring the lower band and 50-day average into focus.
- Ideal Entry Range: 103.18 to 106.58
- Exit Target: 111.25
- Stop Loss protection: below 101.92, with the 101.21 area as the deeper line in the sand
For non-traders, this means Disney is not showing enough strength to chase, but it also has not lost the technical footing that would justify a bearish call. “I’m watching whether the stock can stop leaking momentum and reclaim the middle of the range.”
Summary Data DIS
| Last price | 105.31 USD |
| Change 1 day / 5 days / 1 month | -1.73% / -2.58% / 0.38% |
| Trend / MA-cross | sideways / none |
| SMA20 / SMA50 | 106.58 / 101.21 |
| RSI (14) / Stochastic %K | 50.6 / 20.4 |
| Bollinger %B / ATR | 36% / 2.27 |
| Support / Resistance 20 days | 103.18 / 111.25 |
| Data as of | 4 September 2026 20:30 WIB |
Track DIS stock price daily: live levels, support/resistance and our full DIS analysis history.