XOM Stock Drops 1.69% Today, Momentum Weakens
On September 7, 2026: price 159.47 USD, trend sideways, RSI 50.8, support 156.44, resistance 166.15. technical analysis of xom stock. XOM Stock Drops — full…
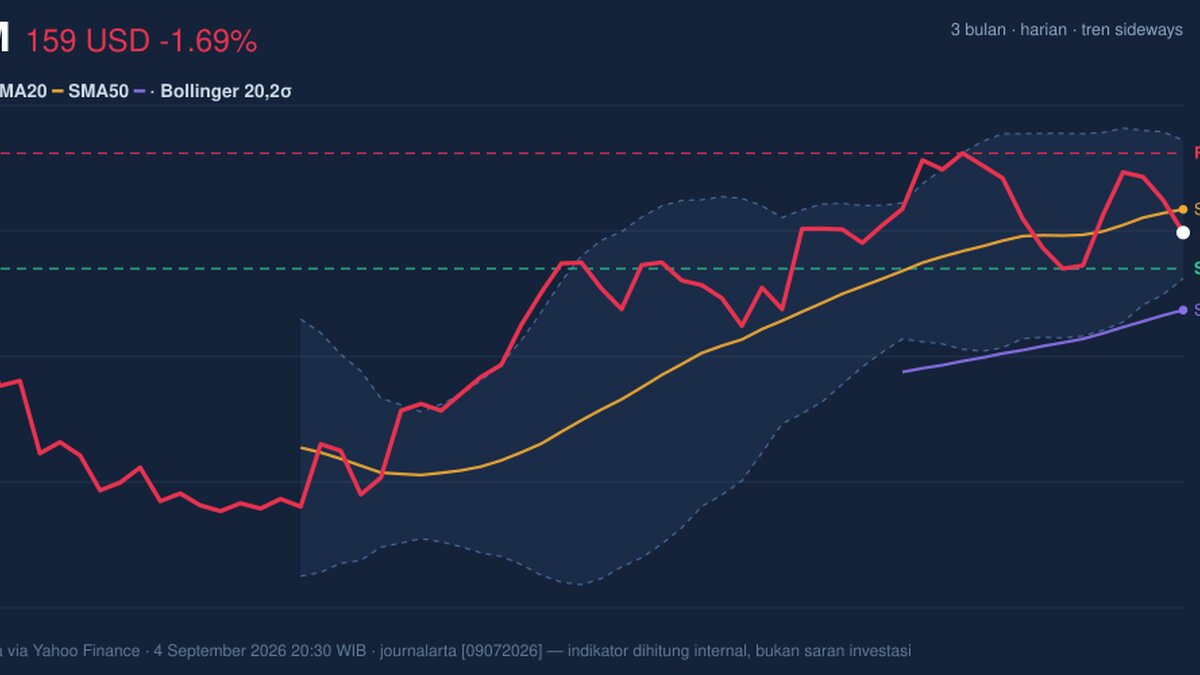
ExxonMobil shares on the NYSE fell to 159.47 on 4 September 2026 at 20:30 WIB, slipping 1.69% from the previous close of 162.21 as the stock drifted back below its short-term average. The move leaves XOM in a sideways pattern rather than a clean uptrend, and the chart now shows a market that is trying to hold its recent gains without yet proving it can extend them.
Trend & Price Action
The most important signal here is positioning: XOM is trading below its SMA20 at 161.42 but still well above its SMA50 at 152.96. That usually means the stock has not broken its broader structure, yet short-term buying pressure has weakened enough to pull price back under the near-term trend line. In plain terms, the medium-term base remains intact, but the immediate rhythm has turned choppier.
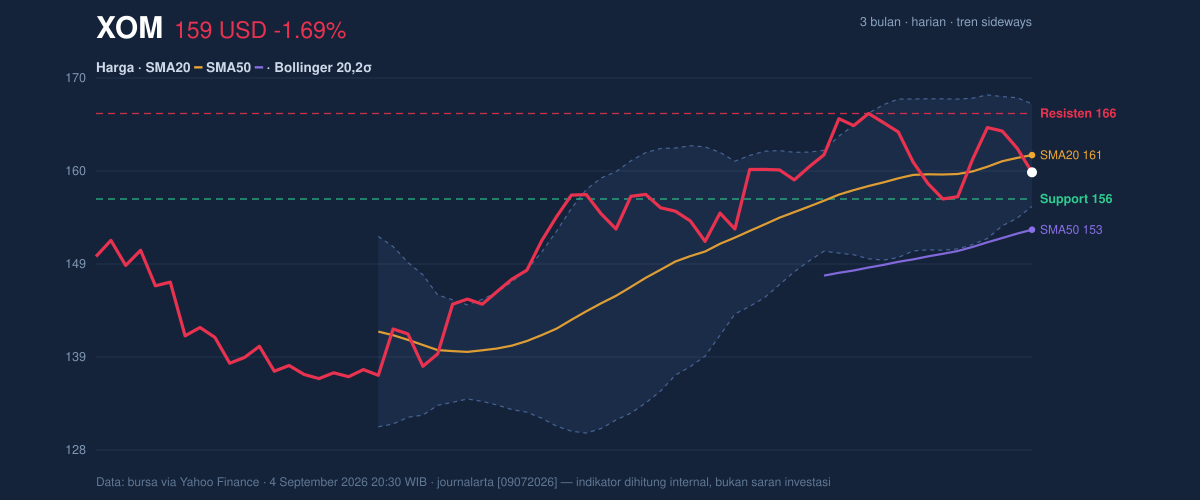
The lack of a fresh MA-cross matters. When a stock has no new moving-average crossover, traders often read the setup as unfinished rather than decisive. Here, the SMA20 slope of 1.34% over 5 days still points higher, which suggests the short average is not rolling over aggressively. That is why the picture is not outright bearish; it is more a pause within a broader range.
The share price is also sitting at only 31% of the 20-hour range, with support at 156.44 and resistance at 166.15. That placement is telling: XOM is closer to the lower half of its recent band, but not yet at the point where sellers have fully taken control. The stock’s 3-month high of 168.64 and 3-month low of 134.95 show there is still ample room within the range, but the latest pullback suggests the market is testing whether recent strength can survive a softer patch.
Oscillators & Momentum
The momentum indicators are mostly neutral, which is often a sign of indecision rather than conviction. RSI at 50.8 sits almost exactly on the midpoint, meaning the stock is neither overbought nor oversold. That matters because a midline RSI usually signals balance: buyers and sellers are roughly matched, so the next directional move may need a catalyst.
Stochastic %K at 31.2 and %D at 49.7 leans weaker than RSI, showing short-term momentum has faded faster than the broader momentum gauge. Stochastic is useful for spotting turning points, and here it suggests price is closer to a lower momentum zone without yet flashing a full reversal signal. The gap between %K and %D also implies the stock has not regained short-term traction.
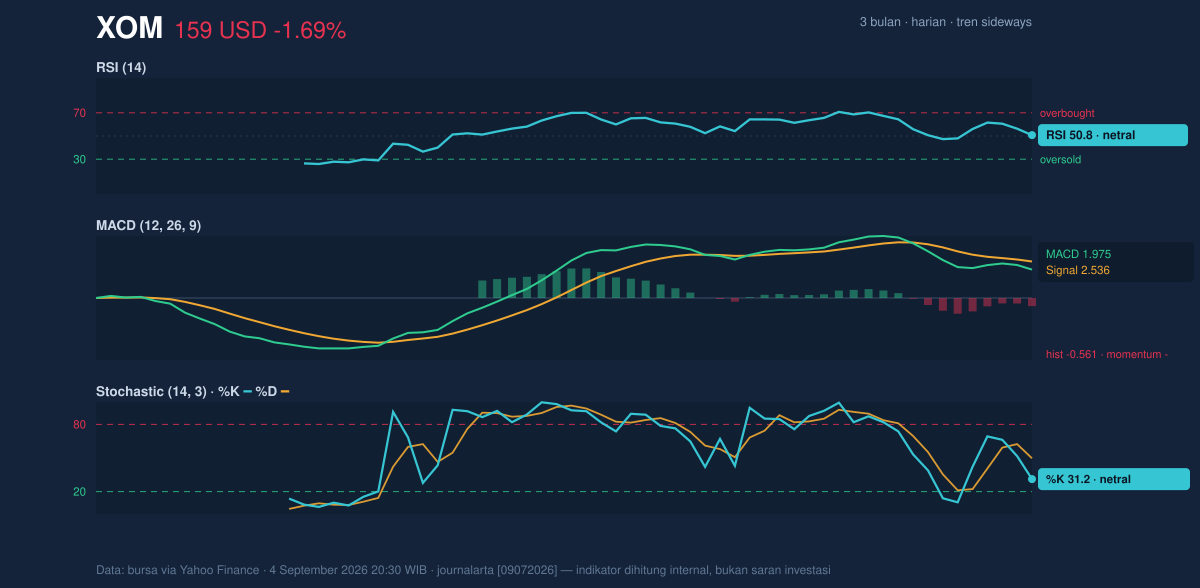
The clearest warning is from MACD. With MACD at 1.975 below its signal line at 2.536 and a histogram of -0.561, momentum is negative. In simple terms, the trend is still positive enough on the longer baseline to stay above the zero line, but the faster component has slowed below the signal line, which often means upside momentum is losing speed. That combination fits the broader sideways tone: the stock is not breaking down, but it is not accelerating either.
Volatility & Volume
The volatility setup is more interesting than the day’s price move. Bollinger Bands show the upper band at 167.24, the middle band at 161.42, and the lower band at 155.61, with %B at 33%. That means price is trading in the lower third of the band structure, closer to support than to the upper edge, while still inside the envelope. The key detail is the 7.2% band width, which is constricting. A squeeze like this often signals that a larger move may be building, because quiet trading tends to precede expansion.
ATR adds another layer. At 3.33, or 2.1% of price, volatility is moderate rather than extreme. So while the band squeeze hints at a possible breakout phase ahead, ATR says the stock is not currently in a disorderly market. That combination usually produces a cleaner technical setup than a highly volatile one, because the move that follows can be easier to read.
Volume, however, is not fully confirming the price action. The latest volume of 16,192,900 was about 1.2× normal versus the 20-hour average of 14,045,210, which shows participation increased on the down day. That is not automatically bearish, but it does mean the dip was not caused by thin trading. The OBV is falling, and that is the more important signal: on-balance volume tracks whether money flow is accumulating or leaving the stock. A declining OBV tells us that recent trading has been more consistent with distribution than accumulation, even while the price remains above the longer moving average.
Key Levels & Scenarios
The chart structure is now centered on whether XOM can reclaim the middle of its range. 161.42 is the first technical pivot because it is both the SMA20 and the Bollinger middle band. A move back above that level would suggest the stock is recovering its short-term trend. Above that, 166.15 is the next hurdle, and a push through it would place the stock back near the upper band at 167.24 and closer to the 3-month high of 168.64.
On the downside, 156.44 is the immediate support to watch. A clean break below that floor would weaken the sideways structure and expose the lower Bollinger band at 155.61, with the SMA50 at 152.96 acting as the next broader support zone. Because OBV is already declining, a failure to hold 156.44 would carry more weight than it might in a rising-volume accumulation phase.
Technical Verdict: HOLD (wait & see)
- RSI at 50.8 and Stochastic at 31.2/49.7 are neutral, so momentum does not yet justify a decisive directional call.
- MACD at 1.975 below signal 2.536 with a -0.561 histogram shows short-term momentum is still negative.
- Price below SMA20 at 161.42 but above SMA50 at 152.96 points to a stock that is still structurally supported, yet not convincingly strengthening.
- Verdict invalidated if price breaks below 156.44, which would weaken the current range and challenge the lower Bollinger structure.
- Ideal Entry Range: 156.44 to 161.42
- Exit Target: 166.15 to 167.24
- Stop Loss Protection: below 155.61, with deeper risk near 152.96
In plain English, XOM looks stable but not yet strong enough to prove the next move is up. The next scheduled technical test is whether the stock can reclaim 161.42 and then challenge 166.15 after this week’s squeeze in the Bollinger Bands.
Summary Data XOM
| Last price | 159.47 USD |
| Change 1 day / 5 days / 1 month | -1.69% / 1.76% / 4.20% |
| Trend / MA-cross | sideways / none |
| SMA20 / SMA50 | 161.42 / 152.96 |
| RSI (14) / Stochastic %K | 50.8 / 31.2 |
| Bollinger %B / ATR | 33% / 3.33 |
| Support / Resistance 20 days | 156.44 / 166.15 |
| Data as of | 4 September 2026 20:30 WIB |
Track XOM stock price daily: live levels, support/resistance and our full XOM analysis history.