T Momentum Weakens: Stock Drops 1.95% (September 7, 2026)
On September 7, 2026: price 25.68 USD, trend uptrend, RSI 60.3, support 24.05, resistance 26.19. technical analysis of t stock. Momentum Weakens — full details…
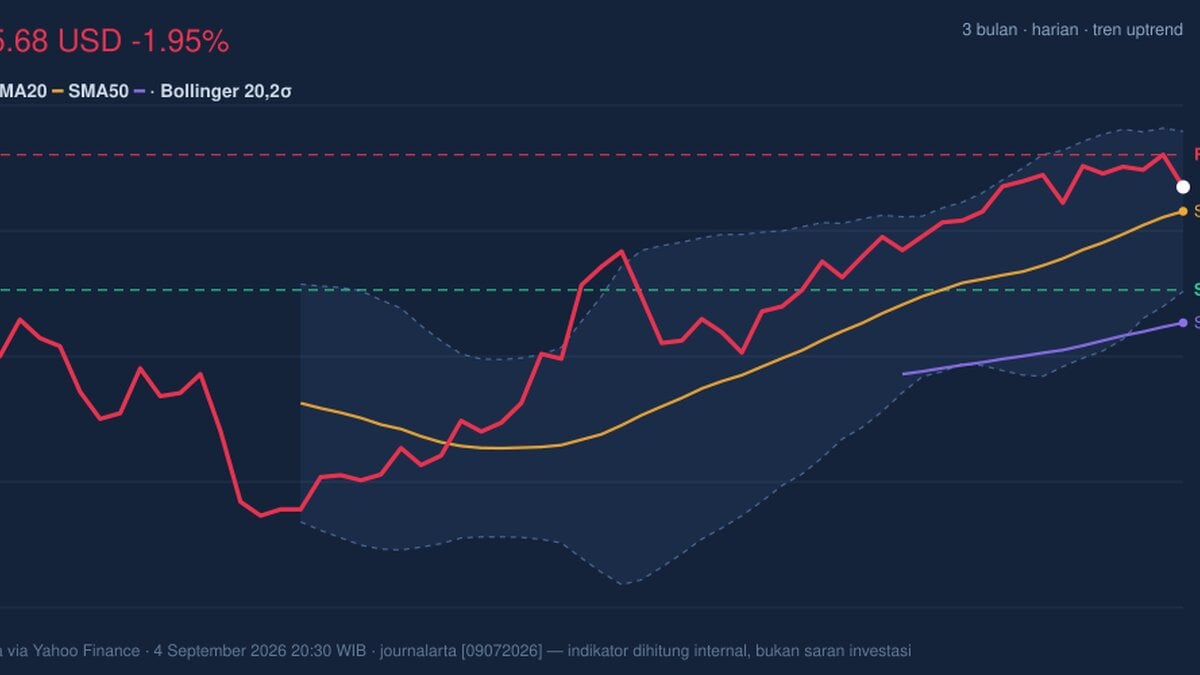
AT&T closed at 25.68 USD, down 1.95% on the day, but the broader pattern still points upward. The stock is trading above its SMA20 at 25.29 and well above its SMA50 at 23.53, which means the medium-term structure remains constructive even after the latest pullback. The message from the tape is not that the trend has broken; it is that momentum has cooled while price remains in the upper half of its recent range.
Trend & Price Action
The chart shows AT&T sitting in an uptrend, with the SMA20 rising 2.47% over 5 days. That slope matters more than the one-day decline: it tells investors the average price has been climbing, so dips are still being absorbed rather than turning into a broader breakdown. With the stock above both moving averages and no fresh MA-cross, the trend has not yet produced the kind of signal that usually marks a decisive shift in direction.
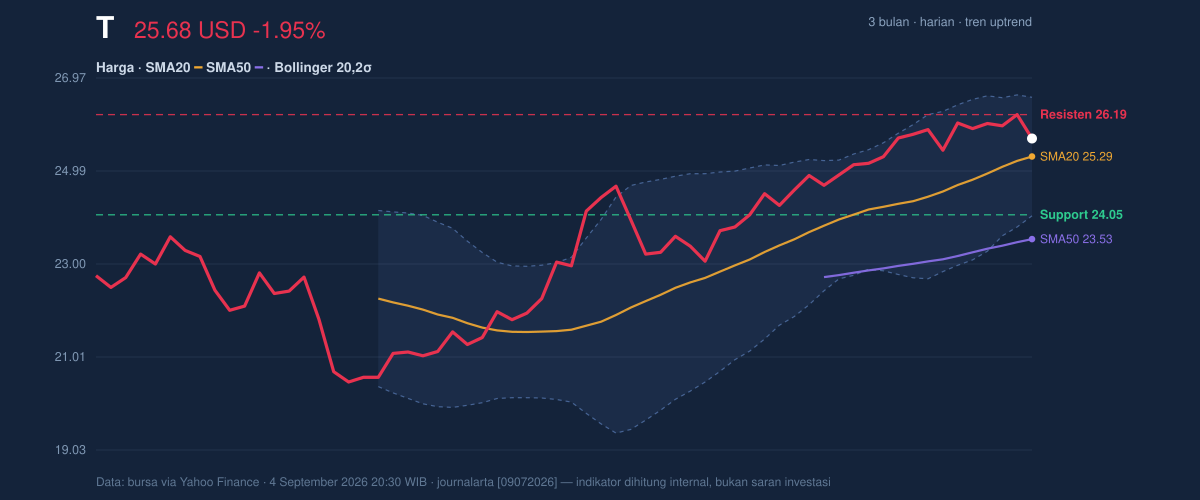
Price is also positioned at about 76% of the 20-hour range, using the 24.05 support and 26.19 resistance levels. In plain language, AT&T is closer to the ceiling than the floor, which often means the market is testing whether buyers can keep pushing after a recent run. The 3-month high at 26.44 is only slightly above current levels, while the 3-month low at 19.89 sits far below, underlining how much of the recent recovery has already been reclaimed.
Oscillators & Momentum
The momentum picture is more mixed than the trend. RSI at 60.3 is neutral, which means the stock is not stretched enough to scream overbought, but it is also not washed out enough to suggest a bargain-hunting setup. The Stochastic %K at 52.2 and %D at 70.7 is also neutral, yet the gap between the two lines hints that near-term speed has slowed. That often happens when a stock pauses under resistance rather than when a new leg is starting.
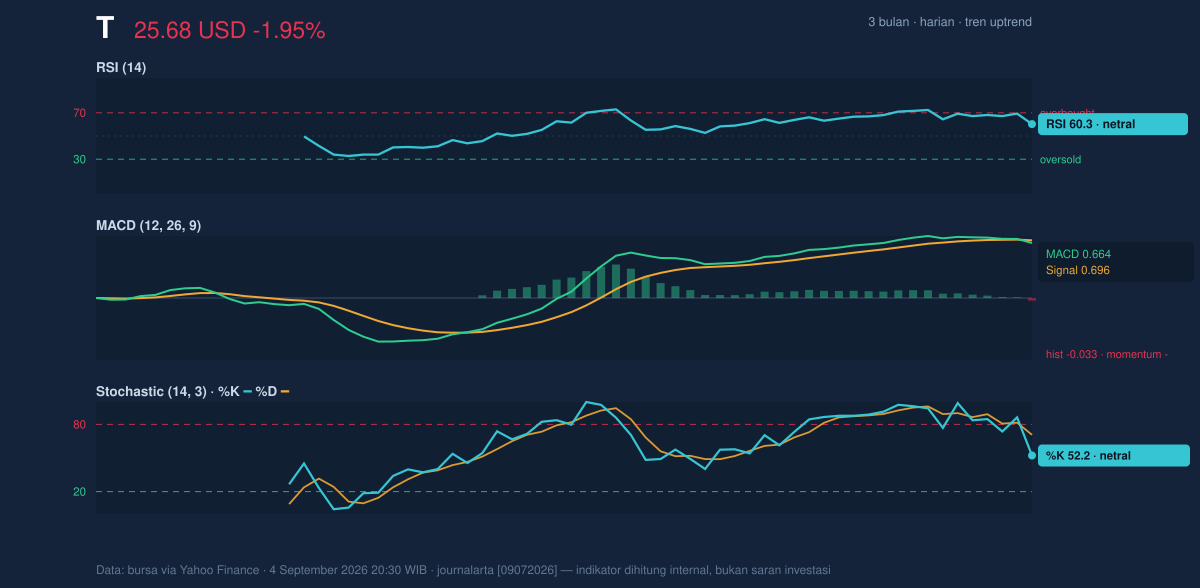
The clearest caution comes from MACD at 0.664 versus signal at 0.696, with a histogram of -0.033. MACD is a trend-following momentum tool; when the histogram turns negative, it means the price trend is still positive on the longer line, but the shorter-term push is losing force. In other words, the trend is intact, but the engine is not accelerating. That is consistent with a stock that has risen into resistance and is now digesting gains.
Volatility & Volume
Volatility is not flashing panic. ATR at 0.47, or 1.8% of price, suggests movement is moderate rather than explosive. The Bollinger Bands are also fairly orderly, with the upper band at 26.56, middle band at 25.29, and lower band at 24.03. The 65% %B reading means price is above the middle of the band structure, but not pressing the top band hard enough to imply a breakout is already underway. The 10.0% band width is normal, so this is not a squeeze waiting to snap; it is a standard trading environment where incremental moves matter.
Volume adds an important nuance. The latest session saw 26,146,000 shares change hands, below the 20-hour average of 31,141,695, or 0.8x normal. That tells us the latest dip did not arrive with strong participation. At the same time, OBV is rising, which means cumulative volume has been supporting the advance over time even if the latest session was quieter. When OBV rises while price stalls, it often signals that longer-term accumulation has not fully disappeared; buyers are still present, but they are not forcing the issue right now.
Key Levels & Scenarios
The immediate battleground is clear: 26.19 resistance and 24.05 support. A move back through 26.19 would put the stock closer to the 26.44 three-month high and the 26.56 upper Bollinger band, which are the next visible reference points on the chart. If price fails to hold 25.29, the Bollinger middle band and SMA20 would stop acting as support and begin acting as a test of trend quality. A drop through 24.05 would be more serious because it would hand control to sellers inside the recent trading range.
The core signal is that AT&T remains technically constructive, but momentum has weakened just enough to make resistance the story, not trend acceleration. The stock is still above its key averages, yet the negative MACD histogram and lighter volume say the next move needs confirmation rather than assumption.
Technical Verdict: HOLD (wait & see)
HOLD (wait & see)
- Why: Price is above the SMA20 and SMA50, so the broader trend still leans upward.
- Why: MACD histogram is negative, showing momentum is softer even while trend structure holds.
- Why: Volume is 0.8x normal, which weakens the case for an immediate breakout attempt.
- Verdict invalidated if price breaks below 24.05, because that would mean the recent support floor has failed.
- Ideal Entry Range: 24.05 to 25.29
- Exit Target: 26.19 to 26.56
- Stop Loss protection: Below 24.03
For non-traders: the stock still looks healthy on the chart, but it needs a stronger move through resistance before the next phase becomes clearer.
“Right now, the market is asking AT&T to prove that this rally still has fuel.”
Summary Data T
| Last price | 25.68 USD |
| Change 1 day / 5 days / 1 month | -1.95% / -1.27% / 7.94% |
| Trend / MA-cross | uptrend / none |
| SMA20 / SMA50 | 25.29 / 23.53 |
| RSI (14) / Stochastic %K | 60.3 / 52.2 |
| Bollinger %B / ATR | 65% / 0.47 |
| Support / Resistance 20 days | 24.05 / 26.19 |
| Data as of | 4 September 2026 20:30 WIB |
Track T stock price daily: live levels, support/resistance and our full T analysis history.