CVX RSI Overbought: Stock Gains 0.75% (Juli 24, 2026)
On Juli 24, 2026: price 194.42 USD, trend sideways, RSI 71.2, support 165.69, resistance 194.42. technical analysis of cvx stock. CVX RSI Overbought — full…

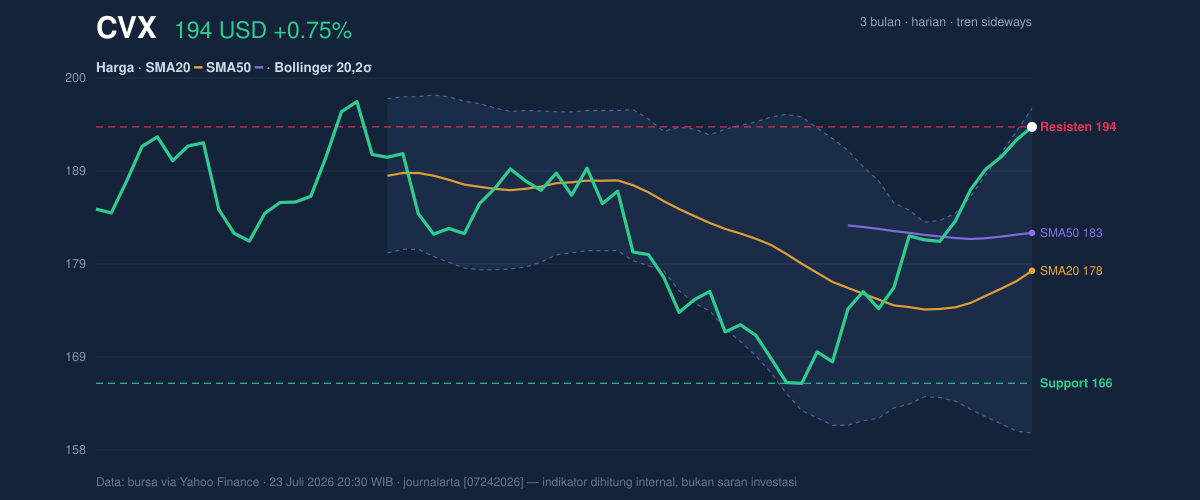
Chevron Corp. shares on the NYSE rose to 194.42 USD, up 0.75% on the day and 13.40% over the past month, but the latest move has pushed the stock into a technically stretched zone, with price sitting at the top of its recent range and just under the upper Bollinger band, according to data from Yahoo Finance as of 23 July 2026, 20:30 WIB. The advance is being driven by positive trend signals, yet momentum is now flashing a warning that the rally may be getting ahead of itself.
Trend & Price Action
The broader structure is still best described as sideways, but that label hides an important shift: the stock is trading above SMA20 at 178.30 and also above SMA50 at 182.54, which tells traders the recent rebound has repaired the short-term damage and put price back in a stronger position than it held a few weeks ago. The SMA20 slope of 2.35% over 5 days shows the near-term trend is leaning upward, even if no fresh moving-average crossover has appeared. In plain terms, the stock is not in a clean breakout trend yet, but the tape has clearly improved.
What matters now is where the price sits within the range. Chevron is at 100% of its 20-hour range, using the session high as resistance at 194.42, while the 3-month high stands at 198.87. That means the shares are pressing into an area where previous rallies have had to prove themselves. The nearby support level at 165.69 remains far below current trading, so the market has already priced in a significant amount of strength.
A lot of the easy upside has already happened.
Oscillators & Momentum
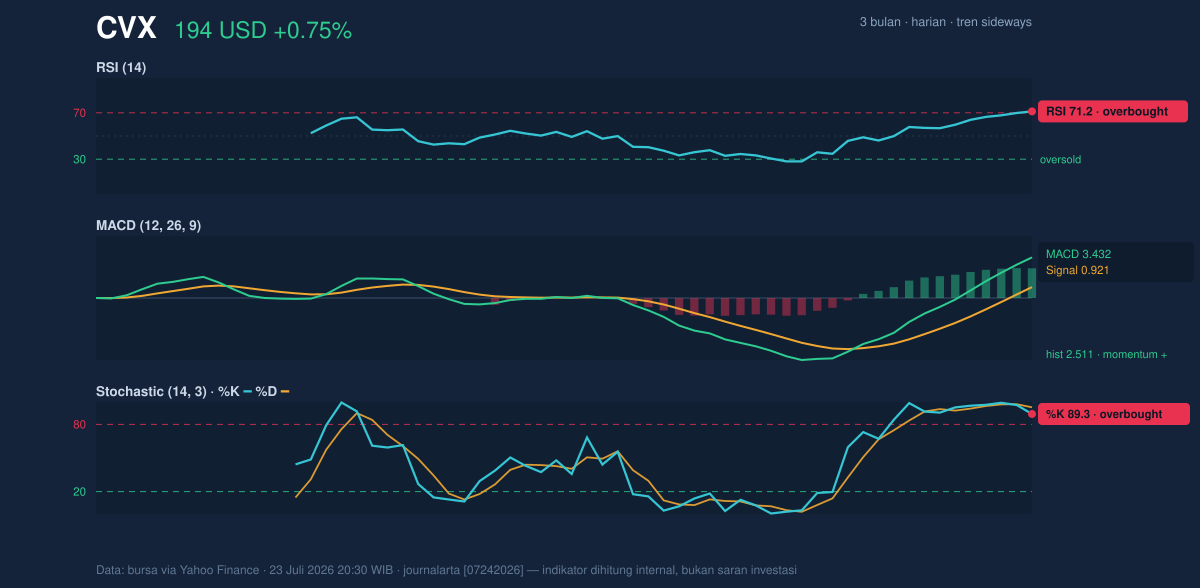
The chart’s momentum panel shows why this move deserves caution. RSI at 71.2 is in overbought territory, and the Stochastic %K at 89.3 with %D at 95.3 is also overbought. For general readers, that does not mean the stock must fall immediately; it means the recent buying has been strong enough that the market may be vulnerable to a pause, consolidation, or a brief pullback as traders take profits. When both oscillators are elevated at the same time, the message is usually that upside momentum is strong but increasingly crowded.
That said, momentum has not rolled over yet. The MACD at 3.432, well above the signal line at 0.921, with a histogram of 2.511, confirms the trend is still positive. MACD is a trend-following gauge, so when it stays above its signal line and the histogram is positive, it suggests buyers still have control. The key nuance is that momentum and overbought conditions are now pulling in different directions: trend-following tools remain constructive, while oscillators warn the rally may be extended.
That is a classic late-stage strength signal.
Volatility & Volume
The Bollinger setup reinforces that tension. Price is trading near the top of the band structure, with the upper band at 196.49 and %B at 94%, which means Chevron is very close to the upper edge of its recent statistical range. The band width has expanded to 20.4%, a sign of high volatility. In practical terms, the stock is no longer coiled tightly; it has already moved enough that further gains may require fresh catalysts rather than just technical follow-through.
ATR, or average true range, sits at 3.71, equal to 1.9% of price, which points to moderate day-to-day movement. So while the Bollinger bands show the broader range has widened, the ATR says the stock is not in a disorderly swing regime. Volume adds another layer: the latest turnover of 8,145,200 was slightly below the 20-day average of 8,684,860, or 0.9× normal. That matters because a move toward resistance on softer volume often lacks the force needed for immediate continuation. Still, OBV is rising, which indicates cumulative buying pressure has been improving even if the latest session did not come with exceptional participation.
In other words: the trend is healthy, but the crowd is not yet rushing in harder.
Key Levels & Scenarios
The nearest technical ceiling is 194.42, with a more meaningful overhead reference at the 3-month high of 198.87. If Chevron can hold above the current zone and extend through that upper area, the chart would begin to look less like a rebound and more like a sustained continuation. On the downside, the first major support to watch is 182.54 at SMA50, followed by 178.30 at SMA20. Those levels matter because they are where the recent uptrend would start to lose its short-term shape. The deeper support at 165.69 is the broader line in the sand from the 20-hour range.
For readers who want the signal in simple terms: the stock is strong, but it is also close to technical resistance and overbought on momentum gauges.
Technical Verdict: HOLD (wait & see)
HOLD (wait & see)
- RSI at 71.2 and Stochastic %K/%D at 89.3/95.3 show the rally is extended and vulnerable to cooling.
- MACD at 3.432 above signal 0.921 and OBV rising confirm buyers still have the upper hand.
- Price above SMA20 at 178.30 and SMA50 at 182.54, but near 194.42 resistance and close to the 196.49 upper Bollinger band, suggests limited near-term room without a fresh catalyst.
Verdict invalidated if price breaks below 178.30, which would weaken the short-term trend structure.
- Ideal Entry Range: 182.54 to 178.30
- Exit Target: 196.49 to 198.87
- Stop Loss protection: 165.69
For non-traders, this means Chevron still looks constructive, but the current price is close enough to resistance that patience matters more than chasing the move.
Chevron’s next technical test is whether it can hold above 194.42 and challenge the 198.87 3-month high.
Summary Data CVX
| Last price | 194.42 USD |
| Change 1 day / 5 days / 1 month | 0.75% / 5.74% / 13.40% |
| Trend / MA-cross | sideways / none |
| SMA20 / SMA50 | 178.30 / 182.54 |
| RSI (14) / Stochastic %K | 71.2 / 89.3 |
| Bollinger %B / ATR | 94% / 3.71 |
| Support / Resistance 20 days | 165.69 / 194.42 |
| Data as of | 23 Juli 2026 20:30 WIB |


