MRK Testing Key Resistance: Stock Gains 2.36% (Juli 24, 2026)
On Juli 24, 2026: price 130.48 USD, trend uptrend, RSI 61.3, support 120.78, resistance 130.48. technical analysis of mrk stock. MRK Testing Key Resistance —…

Merck is pressing against the top of its near-term trading range, and that matters for investors watching whether the recent advance can turn into a cleaner breakout or stall just below resistance. On NYSE data at 23 July 2026 20:30 WIB, MRK last traded at 130.48 USD, up 2.36% on the day and 8.19% over the past month, with the move taking the shares to the edge of their 3-month high at 131.74.
Trend & Price Action
The broader signal remains constructive. Merck is trading above its SMA20 at 126.47 and well above its SMA50 at 120.72, which is the kind of alignment that usually tells traders the stock is still being supported on dips rather than rejected on rallies. The uptrend is also backed by a positive SMA20 slope of 2.06% over 5 days, a sign that the shorter-term trend is not merely drifting higher but doing so with some momentum.
What stands out in the price structure is how close the stock is to the ceiling of its recent range. The chart shows support at 120.78 and resistance at 130.48, meaning the current print sits at 100% of the 20-hour range. That position is important: when a stock is pinned at the top of its range, the market is either preparing to extend higher or pausing before supply reasserts itself. With MRK now just under the 3-month high of 131.74, the tape is telling investors that the next move could be decisive.
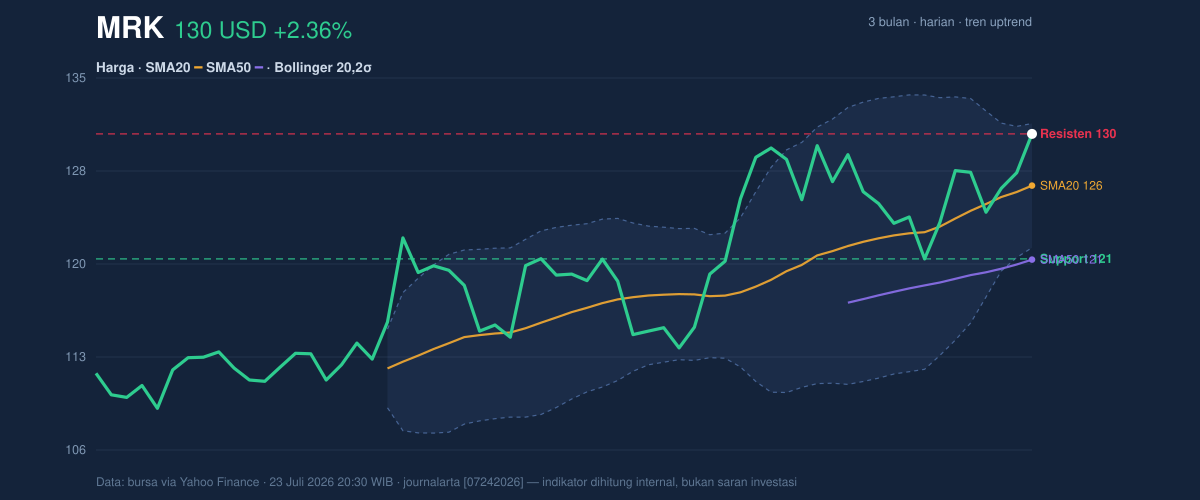
The Bollinger Bands reinforce that tension. Price is near the upper band at 131.28, with %B at 92%, which means the shares are trading very close to the top of the band structure. In plain language, that often signals strength, but it also warns that the stock is no longer cheap relative to its recent trading envelope. The 7.6% band width is relatively tight and described here as a squeeze, which usually reflects compressed volatility before a larger move. A squeeze does not predict direction on its own; it simply says the market is coiling.
Oscillators & Momentum
The momentum picture is mixed, and that is where the story becomes more nuanced. RSI at 61.3 is still neutral, which suggests the stock has room to run before classic overbought conditions become a concern. But the Stochastic %K at 89.1 versus %D at 68.3 is already overbought, indicating the latest push has gone further, faster than the broader trend may justify.
That divergence matters. RSI is the slower, steadier gauge; stochastic is more sensitive to short-term price position. When stochastic is stretched while RSI is only neutral, it often means the stock is strong, but the immediate move is getting crowded. In other words, bulls still have control, but they may need fresh buying to keep the advance from stalling.
The MACD line adds a more supportive note. MACD at 1.938 sits above the signal line at 1.874, with a positive histogram of 0.064. That is a modest but clear confirmation that upside momentum remains intact. The signal is not explosive, but it is positive enough to show that trend-following buyers have not yet stepped aside.
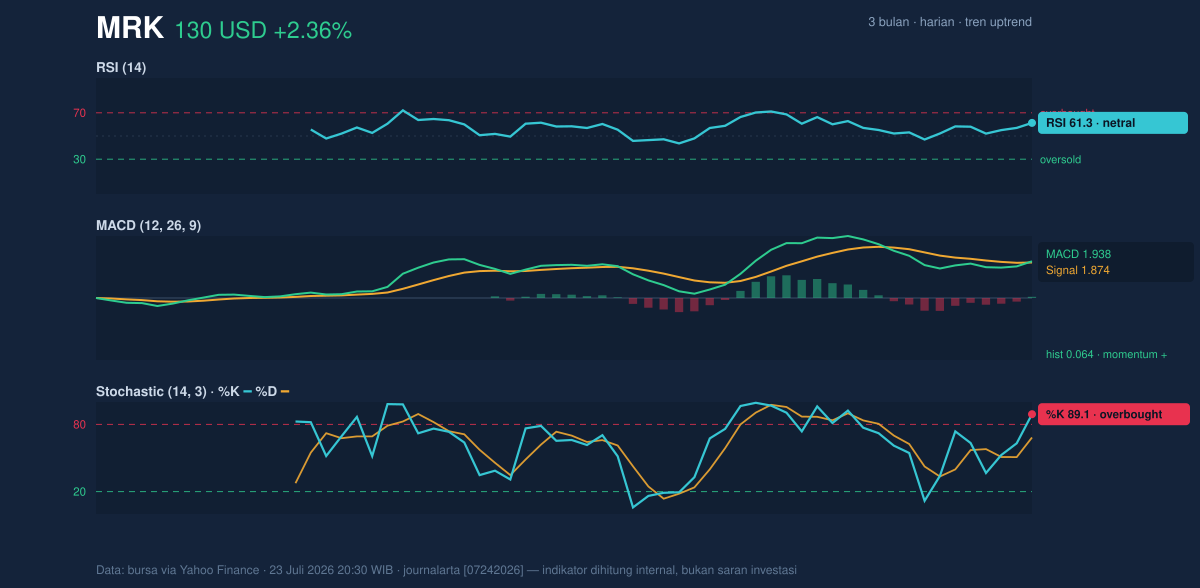
Taken together, the oscillators say MRK is not in a weak trend; it is in a strong one that is starting to look extended in the short run. That combination often produces either a brief consolidation or a breakout attempt. The difference between the two will likely be decided by how the stock behaves around the current resistance zone.
Volatility & Volume
Volatility is moderate, not elevated. The ATR(14) at 3.59, equal to 2.7% of price, suggests that daily swings are present but not extreme. For readers unfamiliar with the term, ATR measures the average size of recent price moves; a reading like this means the stock can still move meaningfully in one session, but it is not currently in panic or event-driven turbulence.
Volume is a little less convincing than price. The latest turnover was 8,530,200, below the 20-day average of 9,900,945, or about 0.9x normal. That matters because rallies built on lighter participation can be easier to fade unless volume expands as price tests resistance. The positive counterweight is that OBV is rising, which implies that, over time, more volume has been flowing into up days than out of them. That is usually a healthier sign than a single-session volume print.
So the setup is not one of euphoric breakout volume. It is more measured: price is pressing upward, volatility is compressed, and participation is supportive but not emphatic.
Key Levels & Scenarios
The chart’s most important line in the sand is the 130.48 resistance, which is also the latest price. If MRK can hold above that area, it would be moving into fresh territory relative to the recent range and challenging the 3-month high at 131.74. If it fails there, the market is likely to revisit the support at 120.78, with the SMA20 at 126.47 acting as the first softer checkpoint on the way down.
What makes this setup interesting is the proximity of price to the upper Bollinger band at 131.28. A clean push through that band, especially with volume improving, would fit the squeeze narrative and could signal that the market is choosing expansion over consolidation. But if the stock cannot clear the band and the recent high, it may simply be overextended in the short term.
Technical Verdict: HOLD (wait & see)
HOLD (wait & see)
- MACD remains positive, showing the trend still has forward momentum.
- Price is above the SMA20 and SMA50, keeping the broader structure constructive.
- Stochastic is overbought and price is near the upper Bollinger band, which raises the risk of near-term fatigue.
Verdict invalidated if price falls below 120.78, where the recent support and range structure would start to fail.
- Ideal Entry Range: 126.47 to 120.78
- Exit Target: 131.74, with extension scope only if resistance gives way
- Stop Loss Protection: below 120.78
For non-traders, this means Merck still looks technically healthy, but it is close enough to resistance that the next move is more about confirmation than chasing strength.
The next test is whether MRK can turn 130.48 into support before the market decides if the squeeze resolves into a breakout or a pause.
Summary Data MRK
| Last price | 130.48 USD |
| Change 1 day / 5 days / 1 month | 2.36% / 2.23% / 8.19% |
| Trend / MA-cross | uptrend / none |
| SMA20 / SMA50 | 126.47 / 120.72 |
| RSI (14) / Stochastic %K | 61.3 / 89.1 |
| Bollinger %B / ATR | 92% / 3.59 |
| Support / Resistance 20 days | 120.78 / 130.48 |
| Data as of | 23 Juli 2026 20:30 WIB |

