OCBC RSI Overbought: Stock Gains 0.91% (Juli 24, 2026)
On Juli 24, 2026: price 28.90 SGD, trend uptrend, RSI 84.4, support 24.66, resistance 29.18. technical analysis of ocbc stock. OCBC RSI Overbought — full…

OCBC Bank extended its climb to 28.90 SGD on SGX, up from 28.64 at the previous close, with the stock now sitting near the top of its recent trading band as investors continue to price in a strong short-term trend. The move is not just a one-day pop: OCBC is up 1.90% over 5 days and 15.83% over 1 month, a pace that signals sustained demand rather than a fleeting reaction. But the technical picture is now more nuanced. Price is running well above its moving averages, momentum remains positive, yet the stock is also flashing classic overbought signals that often appear when a rally starts to stretch.
Trend & Price Action
The chart shows OCBC trading above SMA20 at 26.77 and well above SMA50 at 24.97, which is the clearest sign that the medium-term structure remains constructive. The uptrend is intact, and the stated SMA20 slope of 3.70% over 5 days tells us the shorter trend is still rising rather than flattening out. That matters because a rising moving average often acts like a moving floor: it suggests buyers have been willing to step in at progressively higher levels.
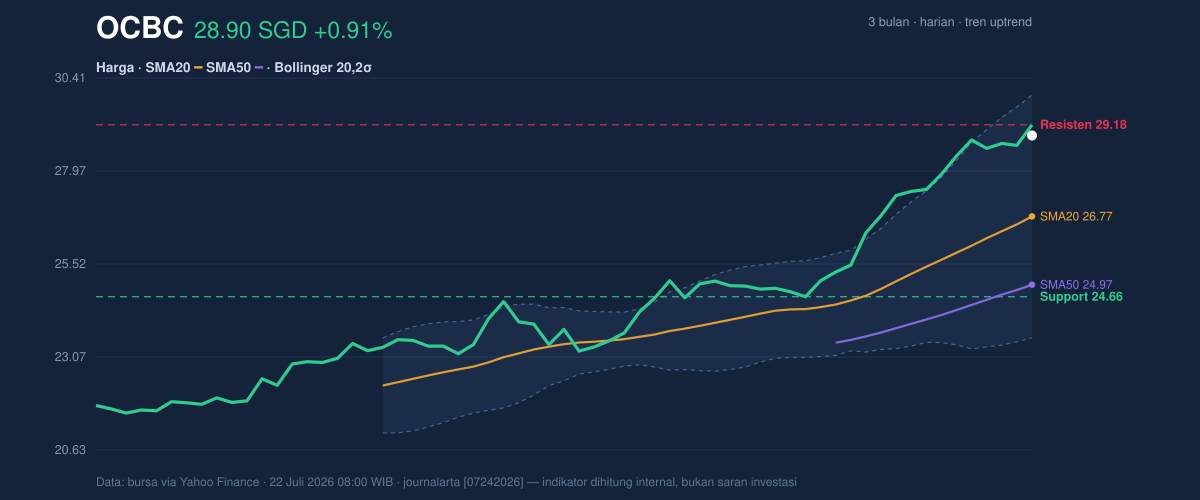
The stock is also trading at 94% of its 20-hour range, with support at 24.66 and resistance at 29.18. That positioning is important. It means the market has already travelled most of the day’s and recent range, leaving less room for easy continuation unless fresh buying appears. The latest close is just shy of the 3-month high at 29.18, so the chart is testing a level that has already capped price before. When a stock approaches a prior high after a strong run, the market is effectively asking whether the breakout has enough force to become a new base or whether sellers will defend the old ceiling again.
Oscillators & Momentum
Momentum is still pointing higher, but it is doing so from an elevated starting point. The RSI at 84.4 and Stochastic %K at 100.0 / %D at 95.2 both sit firmly in overbought territory. In plain language, that does not mean the stock must fall immediately; it means recent gains have been strong enough that the rally may be vulnerable to pauses, consolidation, or sharper pullbacks if buying pressure cools. Overbought readings are most useful as timing signals, not as standalone reversal calls.
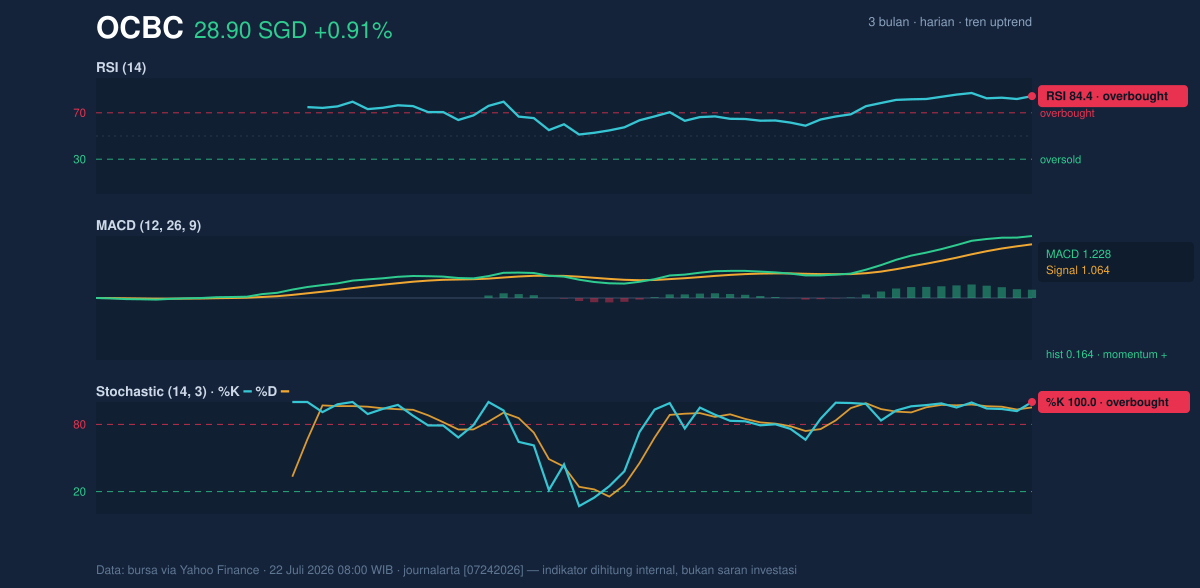
The MACD at 1.228, above its signal line at 1.064, with a positive histogram of 0.164, says trend momentum is still in the bulls’ favour. This is the key counterweight to the overbought RSI and Stochastic. In other words, the stock is extended, but it has not yet lost internal momentum. That combination often appears late in a strong advance: price can keep rising, but the risk of a brief air pocket increases because the market is already stretched.
Volatility & Volume
Bollinger Bands reinforce that stretched-but-still-strong profile. OCBC is trading near the upper band, with %B at 83% and the upper band at 29.97. The band width of 23.9% is described as widening, which usually signals a volatility expansion rather than a quiet range. That matters because widening bands often accompany trend acceleration, but they can also precede sharper two-way swings once a stock gets extended. The ATR(14) of 0.58, or 2.0% of price, shows volatility is present but not extreme relative to the share price.
Volume gives the move more credibility. The latest turnover of 8,487,800 is about 1.4× the 20-session average of 5,960,149, and OBV is rising. That combination suggests the advance is backed by participation rather than a thin, low-liquidity drift. When price rises on stronger-than-normal volume and OBV trends upward, it usually means accumulation is still present. The message is simple: this is not a rally built on fading interest.
Key Levels & Scenarios
The immediate technical battleground is tight. Resistance at 29.18 is the obvious line in the sand because it matches the 3-month high. A clean move through that level would mark a fresh high in the recent range and could encourage momentum traders to stay engaged. If price fails there, the market may rotate back toward the middle of the Bollinger structure around 26.77, which is also the SMA20 and a natural first support area.
The deeper reference point is support at 24.66. If that floor gives way, the chart would lose much of its near-term bullish structure, especially because the stock is currently far above it. Below that, the rising trend would look less like a controlled advance and more like a move that has exhausted itself. For now, though, the balance of signals still favours trend continuation over immediate reversal — just with a noticeably stretched setup.
Technical Verdict: HOLD (wait & see)
HOLD (wait & see)
- RSI at 84.4 and Stochastic at 100.0/95.2 show the stock is overbought, which raises the odds of near-term consolidation.
- MACD at 1.228 above signal at 1.064 still confirms positive momentum, so the uptrend has not broken.
- Price above SMA20 at 26.77 and SMA50 at 24.97, plus volume at 1.4× normal and rising OBV, support the broader bullish structure.
- Verdict invalidated if price breaks below 24.66.
- Ideal Entry Range: 26.77 to 24.66
- Exit Target (Target Price): 29.18 to 29.97
- Stop Loss protection: below 24.66
For non-traders, this means OCBC still looks technically strong, but it is already stretched enough that the chart is better for watching than chasing right now.
Summary Data OCBC
| Last price | 28.90 SGD |
| Change 1 day / 5 days / 1 month | 0.91% / 1.90% / 15.83% |
| Trend / MA-cross | uptrend / none |
| SMA20 / SMA50 | 26.77 / 24.97 |
| RSI (14) / Stochastic %K | 84.4 / 100.0 |
| Bollinger %B / ATR | 83% / 0.58 |
| Support / Resistance 20 days | 24.66 / 29.18 |
| Data as of | 22 Juli 2026 08:00 WIB |


