Shell Stock Gains 2.77%, Testing Key Resistance In Focus
On Juli 24, 2026: price 3,344.00 GBp, trend sideways, RSI 68.4, support 2,872.50, resistance 3,292.00. technical analysis of shell stock.

Shell plc climbed on the London Stock Exchange on 22 July 2026, with the shares last changing hands at 3,344.00 GBp, up from the previous close of 3,254.00. The move keeps the stock above its short- and medium-term moving averages, but it also pushes the price beyond the top Bollinger band, a sign that the rally has become stretched even as momentum remains firm.
Trend & Price Action
The chart shows a stock that is still trading in a broader sideways trend, but one that has tilted upward over the past week. The SMA20 at 3,047.50 sits above the SMA50 at 3,113.58, and the lack of a fresh MA-cross means the market is not flashing a new structural trend signal. What matters more is where the price sits relative to those averages: Shell is trading above the SMA20 and well above the SMA50, which tells us buyers have been willing to pay up in the near term and that recent strength has outpaced the slower trend.
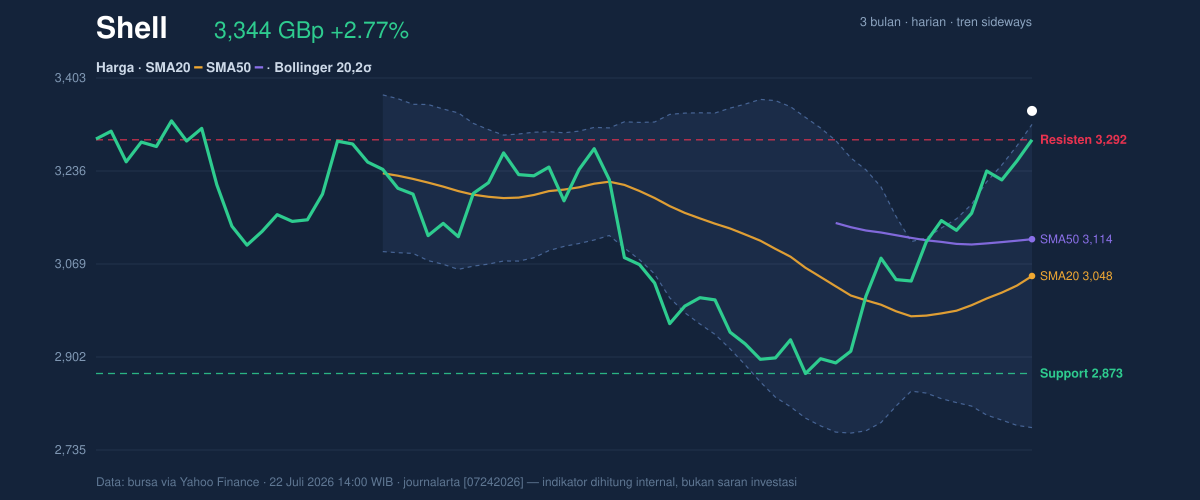
The position inside the recent range is equally important. The stock is trading at 112% of the 20-hour range, above the cited resistance at 3,292.00, which means the market has already cleared a level that had been capping price in the short term. In plain English, that is a breakout attempt rather than a quiet drift higher. The catch is that Shell is also now near the upper edge of its three-month range, with the 3-month high at 3,758.50 and the 3-month low at 2,559.50. That location suggests the market is rewarding the recent move, but it also leaves less room for complacency if momentum fades.
Oscillators & Momentum
The momentum picture is mixed, and that is the key story in the data. The RSI at 68.4 is still described as neutral, but it is close enough to the overbought threshold to show that the stock is running hot without yet screaming exhaustion. More telling is the stochastic reading, where %K at 96.1 and %D at 95.1 are both in overbought territory. Stochastic measures where the close sits within the recent range, so readings this high usually mean the stock has been closing near its highs for several sessions. That is a sign of persistence, but it also warns that the easy part of the rally may already be behind it.
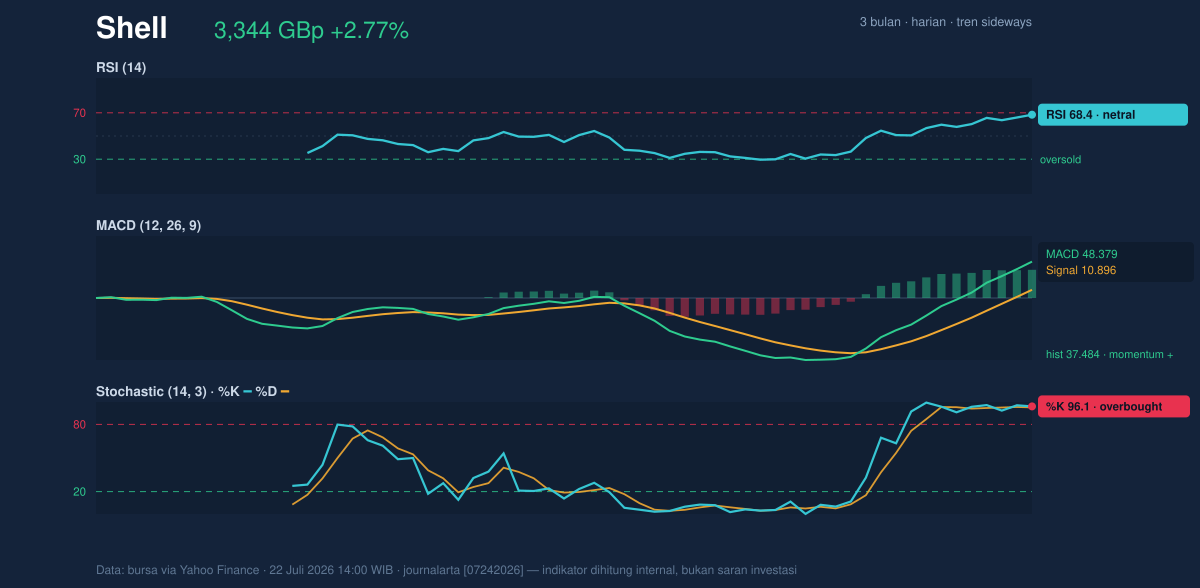
The MACD at 48.379, well above the signal at 10.896, leaves a positive histogram of 37.484. That is the clearest confirmation in the set: trend-following momentum is still pointing higher, and the gap between MACD and signal says the recent advance has not merely been a one-day spike. Put together, the oscillators suggest Shell is in a strong short-term upswing, but one increasingly reliant on price staying elevated rather than on fresh room to expand.
Volatility & Volume
Volatility is not muted. The ATR(14) at 128.43, equal to 3.8% of price, implies the stock can move sharply in either direction in a single session. That matters because a stretched price near the upper Bollinger band is more vulnerable to sharp reversals if buyers step back. The Bollinger upper band at 3,319.69 has already been exceeded, with %B at 104%, which means Shell is trading outside the normal envelope that contains most price action. In technical terms, that often reflects strength, but it also signals a market that may need consolidation to cool off.
The Bollinger band width of 17.9% is described as normal, so this is not a classic squeeze that would hint at an imminent explosive breakout from a compressed base. Instead, the move is happening in a regular volatility regime, which makes the price extension more notable. Volume adds a subtle caution. Last trade volume of 8,101,132 was only 0.9× normal versus the 20-hour average of 9,181,500, so the push higher has not been accompanied by heavy participation. That does not invalidate the move, especially with OBV rising, which shows cumulative buying pressure is still improving. But it does suggest the breakout is not yet backed by a surge of conviction.
Key Levels & Scenarios
The nearest levels are straightforward. Resistance at 3,292.00 has been overtaken, while the most relevant nearby support sits around the SMA20 at 3,047.50 and the lower short-term support at 2,872.50. Below that, the Bollinger middle band at 3,047.50 acts as the first line that would show whether the advance is still holding its shape. If Shell stays above that zone, the chart continues to favor the bulls. If it slips back below the resistance it just cleared, the move starts to look like an overextension rather than a clean breakout.
The stronger signal would come if price can hold above 3,319.69 and keep the MACD positive without the stochastic rolling over too quickly. If it fails to hold 3,047.50, the recent rally loses much of its technical credibility and the market would likely be back inside the prior range. The combination of a stretched Bollinger reading, an overbought stochastic, and a still-positive MACD is the classic setup where strength and fatigue coexist.
Technical Verdict: HOLD (wait & see)
HOLD (wait & see) — the trend is positive, but the stock is already extended above the upper Bollinger band and the stochastic is overbought, which makes fresh upside harder to chase without confirmation.
- Strongest reasons:
- MACD is bullish with the histogram firmly positive, so trend momentum remains intact.
- Price is above SMA20 and SMA50, showing the shares are still trading above their short- and medium-term averages.
- %B at 104% and stochastic overbought warn the move is extended and vulnerable to a pause.
- Verdict invalidated if price falls below 3,047.50, which would put Shell back at the Bollinger midpoint and the SMA20.
- Ideal Entry Range: 3,047.50 to 3,113.58
- Exit Target (Target Price): 3,319.69 to 3,344.00
- Stop Loss protection: below 2,872.50
For non-traders, this means Shell still looks technically firm, but the share price is already running hot enough that the next move matters more than the last one.
“It’s a strong chart, but one that is starting to look tired at the top.”
Summary Data Shell
| Last price | 3,344.00 GBp |
| Change 1 day / 5 days / 1 month | 2.77% / 6.85% / 13.49% |
| Trend / MA-cross | sideways / none |
| SMA20 / SMA50 | 3,047.50 / 3,113.58 |
| RSI (14) / Stochastic %K | 68.4 / 96.1 |
| Bollinger %B / ATR | 104% / 128.43 |
| Support / Resistance 20 days | 2,872.50 / 3,292.00 |
| Data as of | 22 Juli 2026 14:00 WIB |


