XOM Stock Gains 1.58%, RSI Overbought In Focus
On Juli 24, 2026: price 156.89 USD, trend sideways, RSI 72.2, support 136.06, resistance 156.89. technical analysis of xom stock. XOM Stock Gains — full…

ExxonMobil climbed to 156.89 USD on the NYSE on 23 July 2026, extending a short-term rally that has lifted the shares 1.58% in one day, 7.50% over five days and 14.60% over one month, according to Yahoo Finance data. The move matters because the stock is now trading at the very top of its recent range, which usually tells traders that momentum is strong but also that the margin for error is getting thinner.
Trend & Price Action
The chart shows ExxonMobil still in a sideways broader trend, even after the recent push higher, with the SMA20 at 142.73 and the SMA50 at 146.44. That means the price is not only above both moving averages, but has also stretched well beyond them, a sign that buyers have taken control in the near term. The MA structure is supportive, yet there is no new crossover, so this is more of a momentum extension than a fresh long-term trend change.
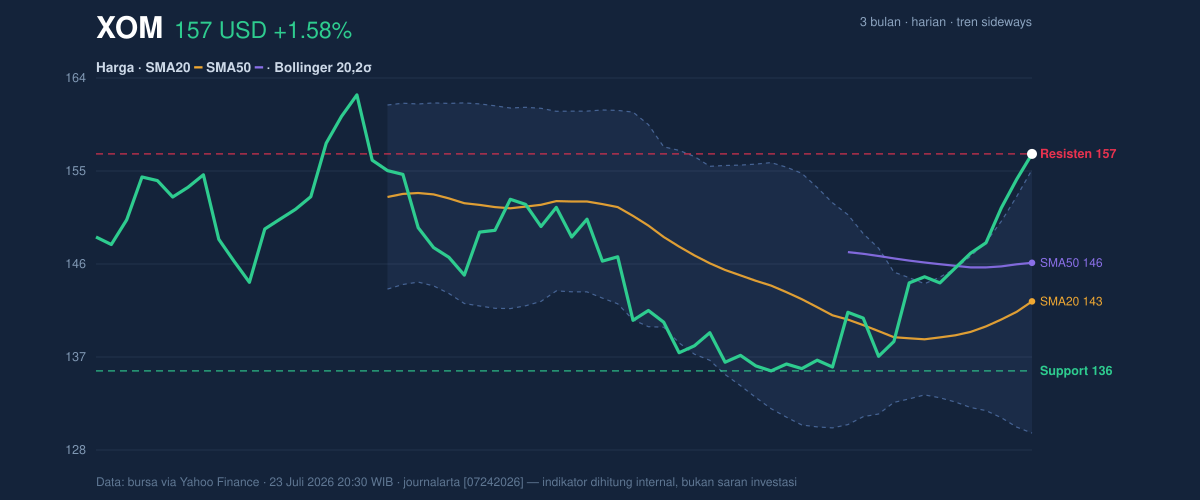
The price at 156.89 is also sitting at 100% of the 20-hour range, with 20-hour support at 136.06 and 20-hour resistance at 156.89. In plain terms, the stock has reached the ceiling of its recent band rather than breaking into open space, which often raises the odds of pause or consolidation. The broader three-month range adds context: ExxonMobil is still below the 3-month high of 163.68, but comfortably above the 3-month low of 134.95, showing recovery without yet testing the prior peak.
Oscillators & Momentum
Momentum indicators are strong, but they are also warning that the move is mature. The RSI at 72.2 and the Stochastic %K at 92.6 / %D at 96.8 both sit in overbought territory, which does not mean the stock must fall, but does mean the recent advance has already been fast enough to leave it vulnerable to cooling off. In practical terms, overbought readings often signal that enthusiasm is high and that new buyers may be paying up after much of the move has already happened.
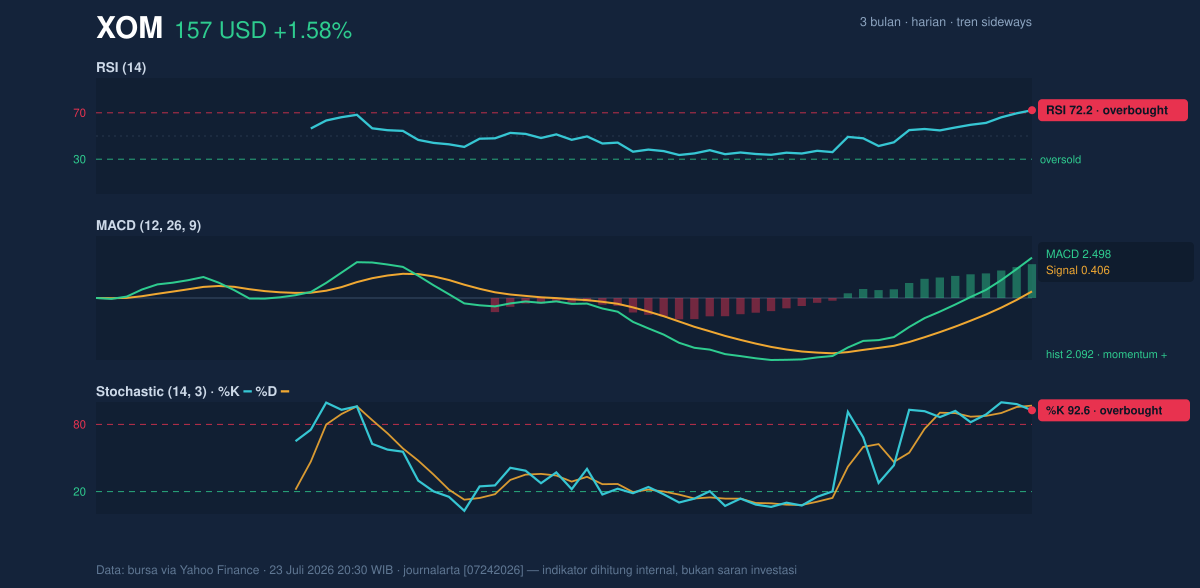
The MACD at 2.498, above its signal line at 0.406, with a histogram of 2.092, tells a different part of the story: upward momentum is still expanding. That combination usually means the trend remains supported by buying pressure rather than merely drifting upward on thin participation. When MACD is positive while RSI and Stochastic are stretched, the message is not contradiction; it is that the rally is still alive, but increasingly extended.
Volatility & Volume
Bollinger Bands help show whether price is merely strong or truly stretched, and ExxonMobil is leaning toward the latter. The upper band at 155.37 has already been exceeded, with %B at 106%, which means the stock is trading above the top of its normal volatility envelope. That often reflects strong demand, but it can also indicate that price has moved ahead of its average path and may need either time or a pullback to re-enter the band.
The Bollinger width of 17.7% is described as normal, so this is not a volatility breakout regime; it is a firm rally inside a standard volatility backdrop. That matters because normal band width suggests the move is being driven more by directional pressure than by a sudden expansion in market turbulence. The ATR at 3.43, or 2.2% of price, points to moderate volatility, meaning daily swings are large enough to matter, but not extreme enough to imply disorder.
Volume is also supportive. Last trade volume was 15,814,400, just above the 20-day average of 15,465,830, or about 1.0× normal. That is not a dramatic surge, but it does show the rally is being accepted by the market rather than fading on weak turnover. The OBV is rising, which is important because on-balance volume tracks whether money flow is generally moving into the stock; in this case, it says the advance has participation behind it.
Key Levels & Scenarios
The immediate technical picture is simple: ExxonMobil is pressing against resistance while momentum remains positive. The key support is 136.06, and the nearest resistance is 156.89, with the next reference above that at the 3-month high of 163.68. If the stock can hold above the current band, the chart suggests a continuation attempt toward that higher range. If it slips back below the upper band and loses the recent breakout area, the market would likely interpret that as a failed extension rather than a fresh trend leg.
The most important signal is not that the stock is rising; it is that the rise has become stretched. Strong MACD momentum is still carrying the move, but overbought RSI, overbought Stochastic and a price above the Bollinger upper band all say the rally is working hard. That combination often leads to either a brief pause or a sharp but shallow pullback before the next directional decision.
Technical Verdict: HOLD (wait & see)
HOLD (wait & see) is the clearest technical call because the chart is bullish, but the stock is also extended.
- MACD is positive and the histogram is strongly above zero, confirming the up-move still has momentum.
- RSI at 72.2 and Stochastic at 92.6 / 96.8 are overbought, which raises the risk of a near-term pause.
- Price at 156.89 is above the upper Bollinger band at 155.37 and at the top of the recent range, so upside is already well advanced.
Verdict invalidated if price falls below 136.06, the stated 20-hour support.
- Ideal Entry Range: 146.44 to 142.73, using the SMA50 and SMA20 as pullback zones
- Exit Target: 163.68, the 3-month high
- Stop Loss protection: below 136.06, the 20-hour support
In plain English: the stock looks strong, but it is already stretched enough that waiting for a better setup makes more sense than chasing the current move.
The next technical checkpoint is whether ExxonMobil can stay above 156.89 and then challenge 163.68, with the market’s next read likely coming from the next session’s price action around that resistance.
Summary Data XOM
| Last price | 156.89 USD |
| Change 1 day / 5 days / 1 month | 1.58% / 7.50% / 14.60% |
| Trend / MA-cross | sideways / none |
| SMA20 / SMA50 | 142.73 / 146.44 |
| RSI (14) / Stochastic %K | 72.2 / 92.6 |
| Bollinger %B / ATR | 106% / 3.43 |
| Support / Resistance 20 days | 136.06 / 156.89 |
| Data as of | 23 Juli 2026 20:30 WIB |


