CRM Stock Gains 6.07% Today, Testing Key Resistance
On Juli 28, 2026: price 173.60 USD, trend sideways, RSI 55.5, support 156.66, resistance 173.79. technical analysis of crm stock. CRM Stock Gains — full…

Salesforce Inc. rose to 173.60 USD on the NYSE, a move that pushed the stock to 99% of its 20-hour range and left it pressing against 173.79 USD resistance, according to Yahoo Finance data for 27 July 2026 at 20:30 WIB. The advance looks technically constructive, but it is not yet a clean breakout. The stock is still described as sideways, which matters: in plain terms, the market is rising inside a broader holding pattern rather than starting a decisive new trend.
Trend & Price Action
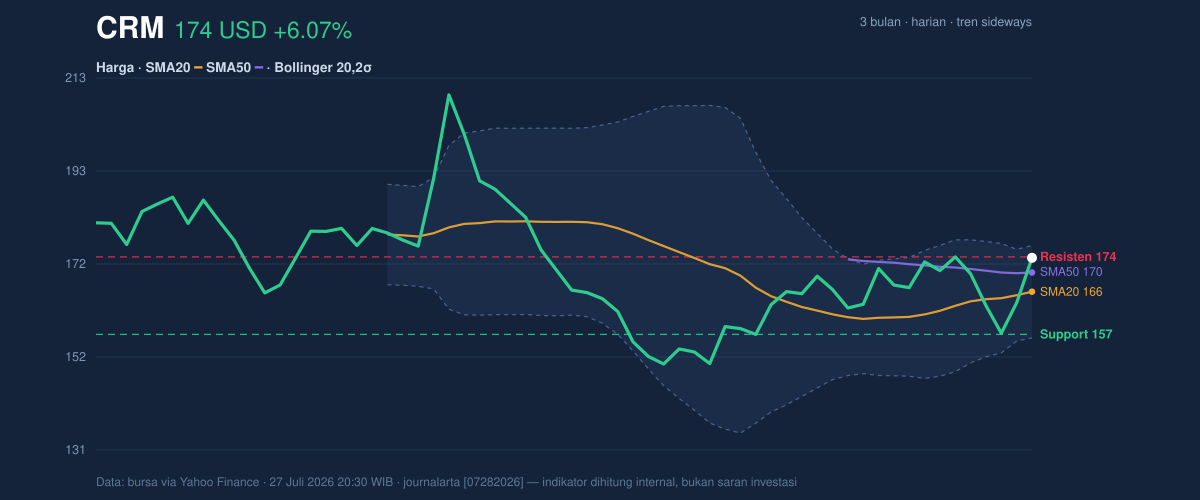
The most important signal in the chart is that price is holding above the SMA20 at 166.09 while remaining just below the SMA50 at 170.33 in terms of trend confirmation. That combination usually means the short-term tone has improved, but the longer trend has not fully turned over. The SMA20 slope of 1.91% over 5 days shows the shorter average is rising, which is a sign that recent buying has been strong enough to lift the baseline. Still, the absence of a new MA-cross tells traders the chart has not produced the classic moving-average confirmation that often accompanies a more durable trend shift.
The stock’s position near the top of its range is also telling. At 173.60 USD, CRM is sitting almost exactly at the 20-hour resistance of 173.79 USD and far above the 20-hour support of 156.66 USD. That means the market has already done much of the work needed to recover from the lower part of the recent band, but it now faces a test: can it hold gains without immediate rejection? The broader 3-month range of 146.32 to 211.34 shows there is still plenty of room above, but the current price is much closer to the recent ceiling than the floor.
Oscillators & Momentum
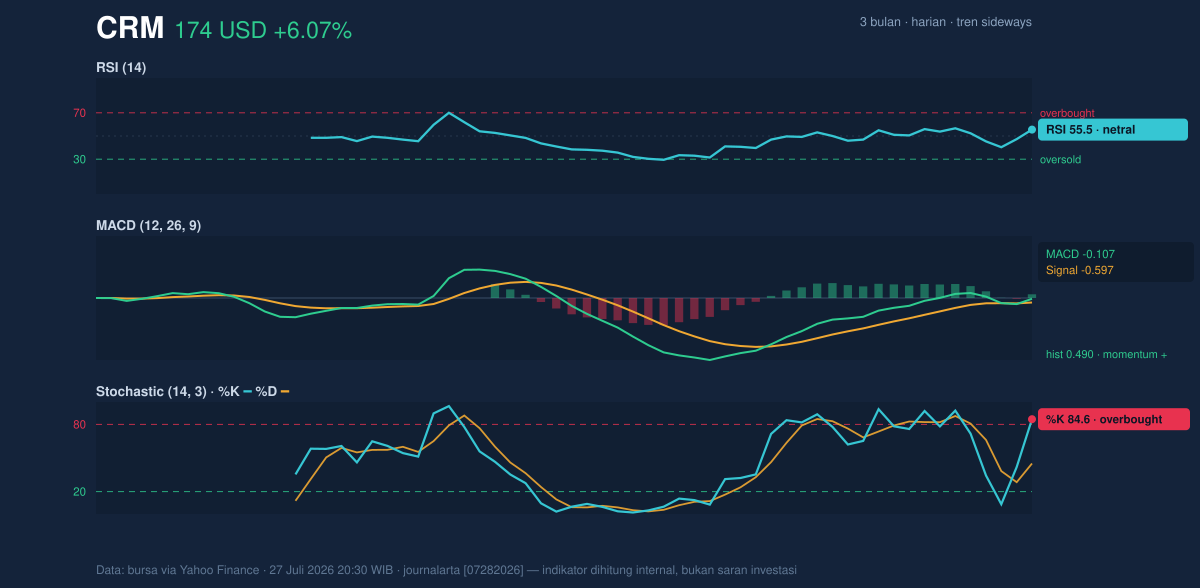
Momentum is mixed rather than uniformly strong. The RSI at 55.5 is neutral, which usually means the stock is not stretched in either direction and still has room to move. By contrast, the Stochastic %K at 84.6 versus %D at 45.1 signals an overbought short-term condition. In practical terms, that tells us the latest push has been fast enough to leave the stock vulnerable to a pause or pullback, even if the broader tone remains positive.
The MACD at -0.107 with a signal line at -0.597 and a histogram of 0.490 is the more encouraging part of the setup. A positive histogram means short-term momentum is improving relative to the trend line, even though the MACD itself is still slightly below zero. That matters because it suggests the stock has not fully escaped its earlier softness, but the direction of travel is better than the absolute level alone would imply. In other words, the momentum is improving before the trend has fully caught up.
Volatility & Volume
The Bollinger Bands frame the current move as extended but not yet extreme. With the price near the upper band at 176.31 and %B at 87%, CRM is trading in the upper portion of its volatility envelope. That usually means the market is pricing in a strong short-term bid, but it also raises the odds of consolidation if buyers fail to force a clean breakout. The 12.3% band width is described as normal, so this is not a squeeze setup where volatility is compressed and a sharp move is likely to erupt. Instead, the market is already active, and the question is direction rather than whether movement will occur.
Volume adds an important caution. Last session volume reached 17,312,000, about 1.4× normal versus the 20-session average of 12,458,800. That is enough to show participation behind the move, which is constructive. But the OBV is down, and that is a subtle warning sign: on-balance volume tracks whether money is broadly accumulating or distributing over time. A falling OBV while price rises can mean the rally is not yet being fully confirmed by the underlying flow of shares. Put simply, the market is buying the stock today, but the longer participation trend is not fully aligned.
Key Levels & Scenarios
The near-term map is clear. 173.79 USD is the immediate resistance to watch, while 166.09 USD is the first important support via the SMA20 and also the Bollinger middle band. Below that, the more meaningful floor is 156.66 USD, which matches the 20-hour support. A push through the upper band at 176.31 USD would strengthen the case that the market is leaving the upper edge of the recent range behind. If price fails to hold above 166.09 USD, the chart would likely revert toward the mid-range rather than continue pressing the highs.
The signal mix is therefore balanced: price action is firm, momentum is improving, but the overbought stochastic and downtrend in OBV argue against assuming the move is already settled.
Technical Verdict: HOLD (wait & see)
HOLD (wait & see)
- RSI at 55.5 is neutral, so momentum is not stretched enough to force a directional call.
- MACD histogram at 0.490 is positive, but the MACD line remains slightly below zero, so trend confirmation is incomplete.
- Stochastic at 84.6 is overbought, which raises the risk of a pause near resistance at 173.79 USD and the Bollinger upper band at 176.31 USD.
- Invalidation condition: this verdict is invalidated if price breaks and sustains below 166.09 USD.
- Ideal Entry Range: 166.09–170.33 USD
- Exit Target: 173.79–176.31 USD
- Stop Loss protection: 156.66 USD
For non-traders, this means the stock is improving, but it is still testing whether the latest rise is strong enough to last.
Summary Data CRM
| Last price | 173.60 USD |
| Change 1 day / 5 days / 1 month | 6.07% / -0.11% / 9.62% |
| Trend / MA-cross | sideways / none |
| SMA20 / SMA50 | 166.09 / 170.33 |
| RSI (14) / Stochastic %K | 55.5 / 84.6 |
| Bollinger %B / ATR | 87% / 8.05 |
| Support / Resistance 20 days | 156.66 / 173.79 |
| Data as of | 27 Juli 2026 20:30 WIB |

