VZ Stock Analysis: Gains 0.46%, Testing Key Resistance
On September 11, 2026: price 49.97 USD, trend uptrend, RSI 58.7, support 48.06, resistance 50.59. technical analysis of vz stock. VZ Stock Analysis — full…
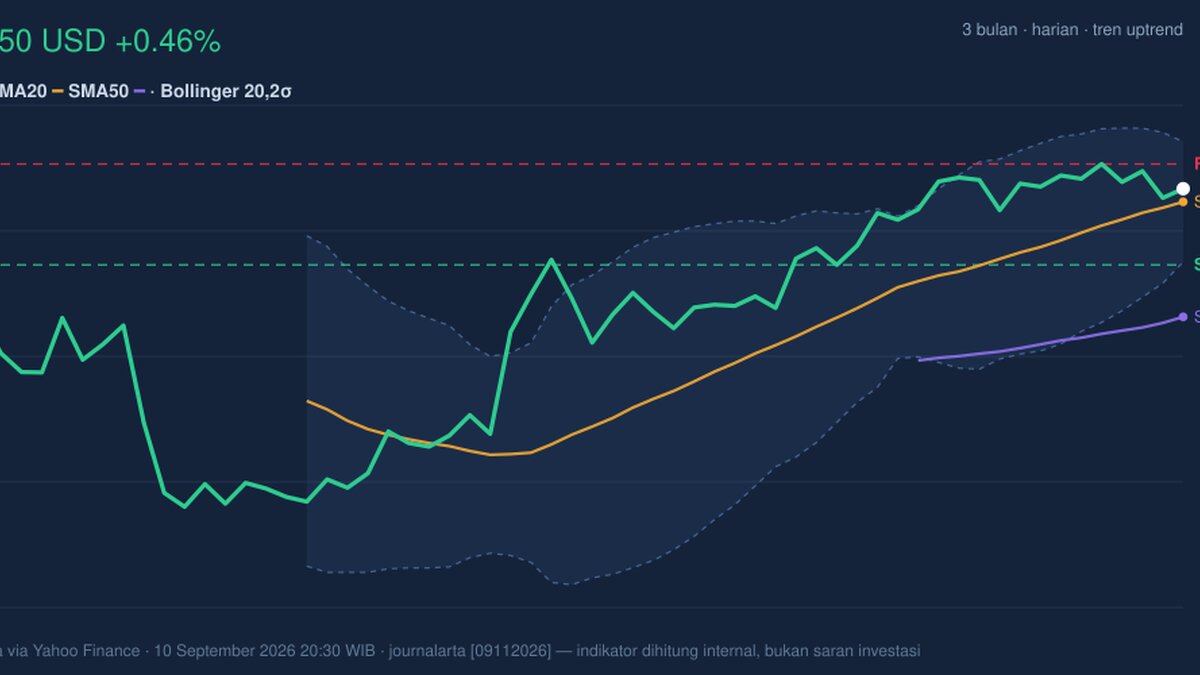
Verizon Communications Inc. traded at $49.97 on the NYSE on 10 September 2026, edging up 0.46% on the day even as the stock still sat below its nearby ceiling, a sign that buyers are present but not yet fully in control. The move matters because Verizon is now pressing against the upper half of its recent range, with the chart showing a stock that has recovered from a weak patch but has not yet broken into a decisively stronger phase.
Trend & Price Action
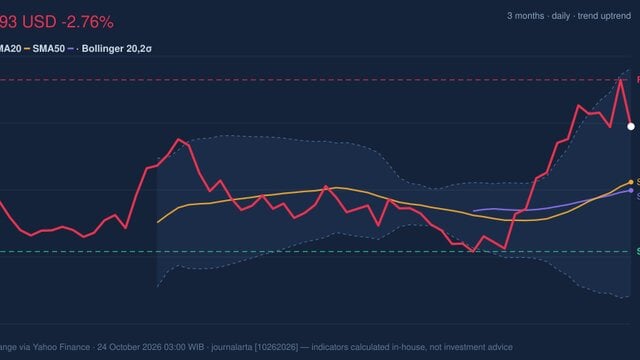
The broad structure is constructive. Verizon is in an uptrend, and the slope of the SMA20 is 1.59% over 5 days, which means the short-term trend is still rising rather than flattening out. The share price is above the SMA20 at $49.64 and comfortably above the SMA50 at $46.75, a classic sign that the shorter and medium-term trend are aligned in favor of strength.
That alignment is important because it shows the recent rebound is not just a one-day pop. It suggests the market has been willing to pay progressively higher prices over the past several sessions, and that the stock is trading closer to the top of its short-term band than the bottom. As shown in the chart, price is also sitting near the upper part of the recent range, with $50.59 acting as the immediate resistance level and $48.06 as the nearest support.

The 3-month high of $50.93 is especially relevant. Verizon is close enough to that level that the market is effectively testing whether the recent recovery has enough force to challenge a prior peak, but it is still just below that threshold. In plain terms, the stock is not in breakout territory yet, but it is close enough that the next move could matter more than the last one.
Oscillators & Momentum
The momentum picture is more mixed than the trend. The RSI at 58.7 is neutral, which means the stock is neither stretched nor washed out. That is often a healthy position in an uptrend, because it leaves room for further gains without immediately signaling exhaustion. The Stochastic %K at 54.5 and %D at 58.6 are also neutral, reinforcing the idea that Verizon is moving, but not at an extreme.

The caution flag comes from MACD, where the line at 0.861 sits below the signal line at 1.001, leaving a -0.140 histogram. For readers, that negative histogram means the stock’s recent acceleration has slowed relative to its own trend signal. It does not reverse the uptrend by itself, but it does suggest momentum is lagging price. In other words, the chart is advancing, yet the engine underneath is not firing as strongly as the price action alone might imply.
That divergence is important. When price is above key averages but MACD is negative, it often means the rally has become more tentative and may need either fresh buying or a pause before it can extend. The absence of an overbought RSI also means the stock is not showing the kind of overheated condition that usually accompanies a clean breakout.
Volatility & Volume
Volatility is contained but not dead. The ATR(14) of 0.82, equal to 1.7% of price, points to moderate daily movement. That matters because a stock with this kind of volatility can still move meaningfully, but it is not swinging wildly enough to suggest panic or disorder. The Bollinger Bands add a more specific clue: price is trading above the middle band at $49.64, while the upper band is $51.15 and the lower band is $48.13. The %B of 61% shows the stock is in the upper half of its band, and the 6.1% band width is narrowing, a squeeze that often precedes a larger move.
A squeeze does not tell direction on its own; it tells compression. Markets tend to store energy when bands tighten, and that energy is eventually released through a break in one direction or the other. In Verizon’s case, the compression sits inside a still-positive trend, which makes the next test of resistance more important than usual.
Volume offers partial confirmation. Trading volume of 18,475,800 was 1.1 times the 20-day average of 17,488,425, so participation was slightly above normal. That is enough to say the move was not happening on thin air, but not enough to call it a decisive surge. The more cautious signal is OBV falling, which means the cumulative volume trend is not fully confirming the price recovery. When price rises while OBV slips, it can imply that the rally is being carried by selective buying rather than broad accumulation.
Key Levels & Scenarios
The market is now boxed between clearly defined levels. The nearest support is $48.06, which also sits just above the lower Bollinger band at $48.13. That makes the zone around $48.06-$48.13 the first area where buyers need to defend the chart. If that area holds, the stock can keep working toward the $50.59 resistance and potentially the $51.15 upper Bollinger band, with the $50.93 3-month high marking the more meaningful hurdle beyond that.
If Verizon fails to hold $48.06, the chart would lose some of its recent constructive tone, because price would slip back toward the lower band and weaken the case that the uptrend is still gaining traction. If it clears $50.59, the market would be signaling that the recent squeeze is resolving upward and that the stock is ready to challenge the $50.93 high.
Technical Verdict: HOLD (wait & see)
HOLD (wait & see) fits best because the trend is positive, but momentum and volume confirmation are not fully aligned yet.
- SMA20/SMA50 alignment is supportive: price is above both averages, which keeps the broader technical structure constructive.
- MACD is negative even while price trends higher, signaling that upside momentum has not fully confirmed the move.
- Bollinger Bands are squeezing, which often precedes a sharper move, but direction has not been decided.
- Verdict invalidated if price falls below $48.06, because that would break the nearest support and weaken the current trend structure.
- Ideal Entry Range: $48.13 to $49.64
- Exit Target (Target Price): $50.59 to $51.15
- Stop Loss protection: below $48.06
For non-traders, that means Verizon looks steady and improving, but the chart still needs clearer proof before the next leg is treated as established.
“The stock is close to a breakout, but it still needs to prove that buyers are willing to defend the $48.06 floor and push through $50.59.”
Summary Data VZ
| Last price | 49.97 USD |
| Change 1 day / 5 days / 1 month | 0.46% / -0.50% / 6.36% |
| Trend / MA-cross | uptrend / none |
| SMA20 / SMA50 | 49.64 / 46.75 |
| RSI (14) / Stochastic %K | 58.7 / 54.5 |
| Bollinger %B / ATR | 61% / 0.82 |
| Support / Resistance 20 days | 48.06 / 50.59 |
| Data as of | 10 September 2026 20:30 WIB |
Track VZ stock price daily: live levels, support/resistance and our full VZ analysis history.