DIS Stock Gains 1.57%, Momentum Weakens In Focus
On September 11, 2026: price 105.82 USD, trend sideways, RSI 52.0, support 103.50, resistance 111.25. technical analysis of dis stock. DIS Stock Gains — full…
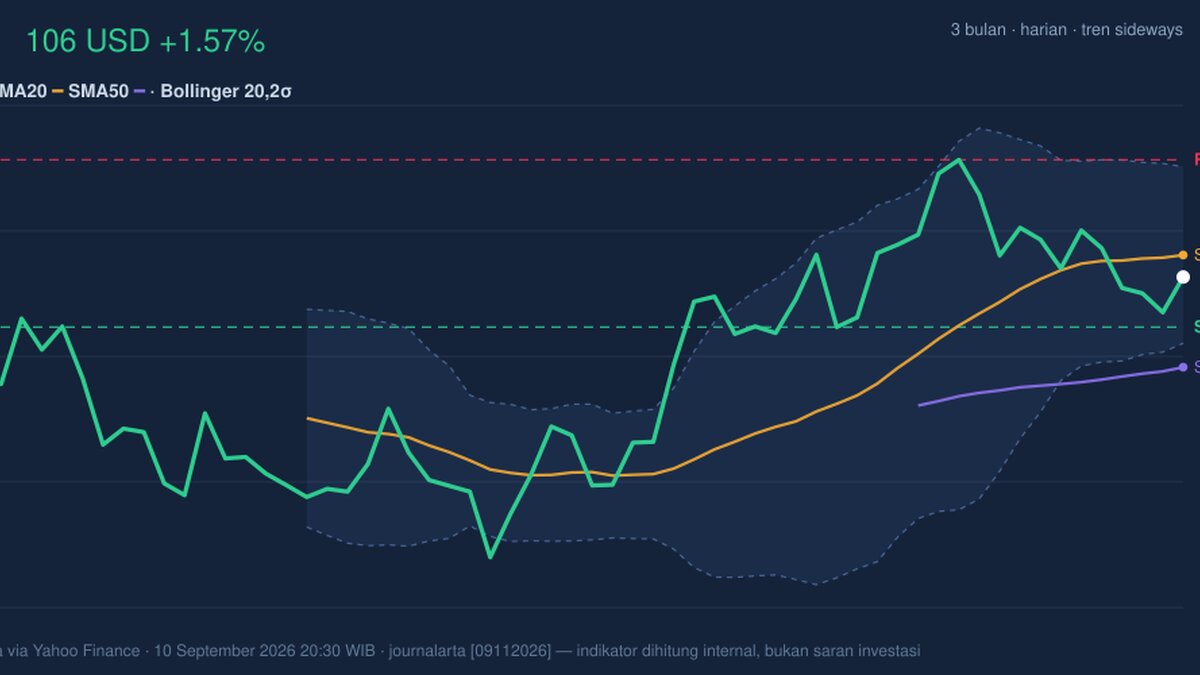
Walt Disney Co. shares rose to 105.82 on the NYSE, up 1.57% from the previous close of 104.18, but the move still leaves the stock trading below its 20-day average and inside a broader sideways pattern, according to data from Yahoo Finance as of 10 September 2026, 20:30 WIB. That matters because it suggests the latest bounce is more a test of balance than a clean trend change: buyers have shown up, but not yet with enough force to reclaim near-term control.
Trend & Price Action
The chart shows Disney sitting in the middle of a contested range rather than in a decisive uptrend or downtrend. The stock is below SMA20 at 106.84 but well above SMA50 at 101.64, a setup that usually signals a market trying to stabilize after a weak patch without fully repairing near-term momentum. The absence of a new MA-cross also tells us the moving averages are not delivering a fresh trend signal; in plain terms, the stock has not produced the kind of alignment that would confirm a stronger directional move.
The broader structure is also important. Disney is trading at about 30% of its 20-hour range, with support at 103.50 and resistance at 111.25. That places the shares closer to the lower half of the recent band, even after the day’s gain. The 3-month high of 111.87 sits just above resistance, while the 3-month low of 92.49 shows the stock has already absorbed a meaningful drawdown this year. The market is not pricing a collapse, but neither is it signaling a clean breakout.

What this means: the stock is boxed in, and the next move is likely to come from a break of that box rather than from gradual drift.
Oscillators & Momentum

Momentum indicators are mixed, which fits the sideways price action. The RSI at 52.0 is neutral, meaning Disney is neither overbought nor oversold; that usually points to a market waiting for a catalyst rather than one already stretched in either direction. The Stochastic at 31.9 / 20.6 is also neutral, but it leans toward the lower part of its range, which can hint at a mild recovery attempt after recent softness. That said, a low stochastic reading alone does not confirm a turn unless price follows through.
The more cautionary signal comes from the MACD at 0.973 versus signal 1.634, with a -0.661 histogram. In practical terms, MACD is still lagging behind its signal line, which means short-term momentum remains negative even though the stock has bounced on the day. This is the kind of divergence that often appears before a trend decision: price stabilizes first, then momentum either catches up or rolls over again.
Put simply: the stock is trying to lift, but momentum has not fully signed off on the move.
Volatility & Volume
Bollinger Bands also point to a market coiling rather than exploding. The upper band is 110.93, the middle band is 106.84, and the lower band is 102.75. With %B at 38%, price is sitting below the midpoint of the band structure, which reinforces the idea that Disney is not yet pressing the upper boundary. More importantly, the 7.7% band width is described as a squeeze, meaning volatility has narrowed. That often precedes a larger move, but it does not tell direction by itself. It only tells us the market is storing potential energy.
ATR(14) at 2.21, or 2.1% of price, says daily swings are moderate rather than extreme. Volume was 7,607,600 versus a 20-day average of 7,585,975, essentially 1.0x normal. That is important because the day’s gain was not driven by a surge in participation. The OBV is falling, which implies that, over time, more volume has been associated with down days than up days. In other words, the market has not yet proven that buyers are accumulating shares with conviction.
Key Levels & Scenarios
The immediate technical map is straightforward. 103.50 is the first line to watch on the downside; if that level gives way, the stock risks sliding back toward the lower Bollinger band at 102.75 and then the 101.64 SMA50. On the upside, 106.84 is the first hurdle because it is both the 20-day average and the Bollinger midline; reclaiming it would improve the short-term tone. Above that, 111.25 is the key resistance, just under the 111.87 three-month high, where prior supply has already appeared.
The setup is therefore conditional. If Disney can push through 106.84 and hold above it, the chart would begin to look less defensive. If it fails to hold 103.50, the current bounce loses credibility quickly. The squeeze in Bollinger Bands means either outcome could arrive with speed.
Technical Verdict: HOLD (wait & see)
HOLD (wait & see) — the stock is caught between a neutral RSI and stochastic reading, a still-negative MACD, and a volatility squeeze that could resolve either way.
- Reason 1: MACD remains below its signal line, so short-term momentum is still negative even after the day’s gain.
- Reason 2: Price is below SMA20 but above SMA50, which is a mixed structure rather than a clean trend.
- Reason 3: Volume is only 1.0x normal and OBV is falling, so the bounce lacks strong participation.
- Verdict invalidated if price falls below 103.50, because that would weaken the current range support and increase the risk of a move toward 102.75 and 101.64.
- Ideal Entry Range: 103.50 to 106.84
- Exit Target (Target Price): 111.25
- Stop Loss protection: below 102.75
In plain English: Disney’s chart is not broken, but it has not yet proved that the recent bounce is strong enough to trust.
“The market is waiting for Disney to show whether this is just a pause — or the start of a real turn.”
Summary Data DIS
| Last price | 105.82 USD |
| Change 1 day / 5 days / 1 month | 1.57% / -2.00% / 2.52% |
| Trend / MA-cross | sideways / none |
| SMA20 / SMA50 | 106.84 / 101.64 |
| RSI (14) / Stochastic %K | 52.0 / 31.9 |
| Bollinger %B / ATR | 38% / 2.21 |
| Support / Resistance 20 days | 103.50 / 111.25 |
| Data as of | 10 September 2026 20:30 WIB |
Track DIS stock price daily: live levels, support/resistance and our full DIS analysis history.