Testing Key Resistance, XOM Stock Gains 0.61% Today
On September 11, 2026: price 165.23 USD, trend uptrend, RSI 60.3, support 156.44, resistance 166.15. technical analysis of xom stock. Testing Key Resistance —…
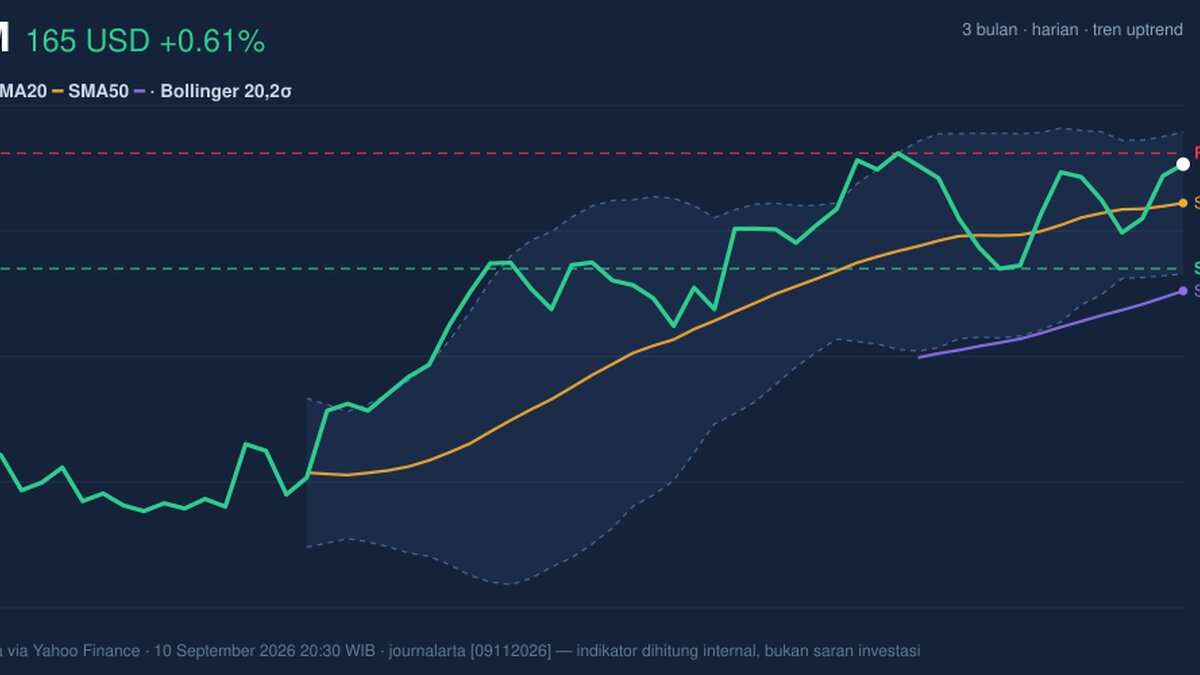
ExxonMobil rose to 165.23 on the NYSE on 10 September 2026, edging above the previous close and extending a steady climb that has kept the stock in an established uptrend. The move matters less for its size than for its placement: XOM is now trading above both its SMA20 at 161.96 and SMA50 at 154.58, which tells investors the shares are still being bid higher across both short- and medium-term windows. But the chart also shows the stock pressing close to a ceiling, with price sitting near the top of its recent range and momentum beginning to lose some force beneath the surface.
Trend & Price Action
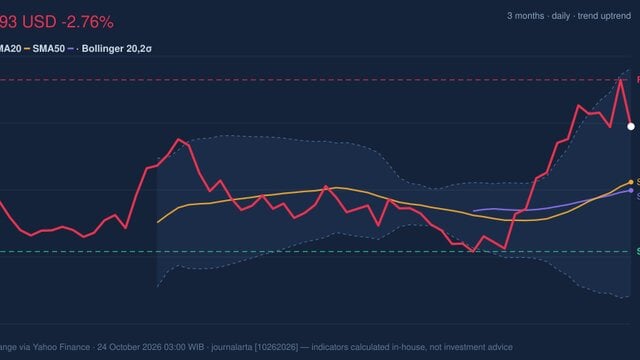
The broader structure remains constructive, as shown in the chart. XOM is above its short-term and medium-term averages, and the SMA20 is still rising at a 0.76% pace over five days, a sign that the latest advance is backed by more than a one-day bounce. That said, there is no fresh MA-cross, which means the market is not flashing a new trend acceleration signal; it is instead continuing an already-formed uptrend.

Price at 165.23 is also positioned at 91% of the 20-hour range, with 20-hour support at 156.44 and 20-hour resistance at 166.15. That placement is important because it suggests the stock is trading close to a short-term decision point rather than in the middle of a comfortable band. The 3-month high at 168.64 is now in sight, while the 3-month low at 134.95 sits far below, reinforcing that the current debate is not about trend survival but about whether the rally can keep extending without pausing.
The Bollinger Bands add another layer to that picture. With the middle band at 161.96, the upper band at 167.93 and the lower band at 156.00, XOM is trading in the upper half of its volatility envelope, reflected in %B at 77%. In plain English, the stock is relatively close to the upper band, which often means strength, but also means less room before the chart starts to look stretched.
Oscillators & Momentum

The momentum signals are more mixed than the trend. RSI at 60.3 is still neutral, so the stock is not yet in the overheated zone that would usually warn of an immediate reversal. Stochastic %K at 78.2 and %D at 61.7 lean higher as well, suggesting the recent advance still has buyers behind it, but not with the kind of clean, fully synchronized momentum that typically accompanies a strong breakout.
The more cautionary signal comes from MACD. MACD at 2.100 sits below its signal line at 2.289, leaving a -0.189 histogram. That negative histogram matters because it shows the trend is still up, but the pace of that trend has slowed enough for short-term momentum to slip behind price. In practical terms, the stock is rising, but the internal engine is not pulling as hard as it was. That kind of divergence does not automatically mean reversal; it often means consolidation first, especially when the broader trend remains intact.
Volatility & Volume
Volatility is moderate rather than explosive. ATR at 3.43, equal to 2.1% of price, implies the stock can move meaningfully in a session, but not in a chaotic way. Combined with the Bollinger Band width of 7.4%, which is squeezing, the chart is hinting at a period of compression. Squeezes matter because they often precede a larger move; the question is direction, and that will likely be decided by whether price can clear resistance or slips back toward the middle band.
Volume supports the advance, though not dramatically. The latest reading of 16,615,300 shares is 1.2× normal versus the 20-hour average of 13,826,955, and OBV is rising. That combination is useful because it shows the move is not being carried by thin trading. Rising OBV means volume is generally confirming the price trend, even if the MACD says the momentum behind it is starting to cool.
Key Levels & Scenarios
The immediate test is straightforward. Resistance at 166.15 is the first level to watch, and then 167.93 from the upper Bollinger Band, with the 3-month high at 168.64 acting as the broader ceiling. If XOM pushes through that cluster, the chart would shift from “trading near the top of the range” to “attempting a range escape.”
On the downside, 156.44 is the nearest support to monitor, closely aligned with the Bollinger lower band at 156.00. A failure there would matter because it would place price back around the middle of the recent structure and weaken the case that the uptrend is intact on a short-term basis. With price already near the top of the range, the market is effectively asking whether this is a breakout setup or a pause before mean reversion.
Technical Verdict: HOLD (wait & see)
HOLD (wait & see)
- Trend is positive: price is above the SMA20 at 161.96 and SMA50 at 154.58, with the SMA20 still rising.
- Momentum is not fully aligned: MACD is below signal and the histogram is negative, which argues for caution near resistance.
- Volatility is compressing: the 7.4% Bollinger squeeze suggests a move is building, but direction is not yet confirmed.
Verdict invalidated if price breaks below 156.44.
- Ideal Entry Range: 156.44 to 161.96
- Exit Target: 166.15 to 167.93
- Stop Loss protection: below 156.00
For non-traders, this means XOM still looks technically healthy, but it is close enough to resistance that the next move matters more than the last one.
The next scheduled test is whether ExxonMobil can close above 166.15 and challenge the 167.93 upper band.
Summary Data XOM
| Last price | 165.23 USD |
| Change 1 day / 5 days / 1 month | 0.61% / 0.66% / 3.43% |
| Trend / MA-cross | uptrend / none |
| SMA20 / SMA50 | 161.96 / 154.58 |
| RSI (14) / Stochastic %K | 60.3 / 78.2 |
| Bollinger %B / ATR | 77% / 3.43 |
| Support / Resistance 20 days | 156.44 / 166.15 |
| Data as of | 10 September 2026 20:30 WIB |
Track XOM stock price daily: live levels, support/resistance and our full XOM analysis history.