AAPL Testing Key Resistance: Stock Gains 3.56% (September 11, 2026)
On September 11, 2026: price 326.57 USD, trend sideways, RSI 58.9, support 305.26, resistance 328.21. technical analysis of aapl stock.
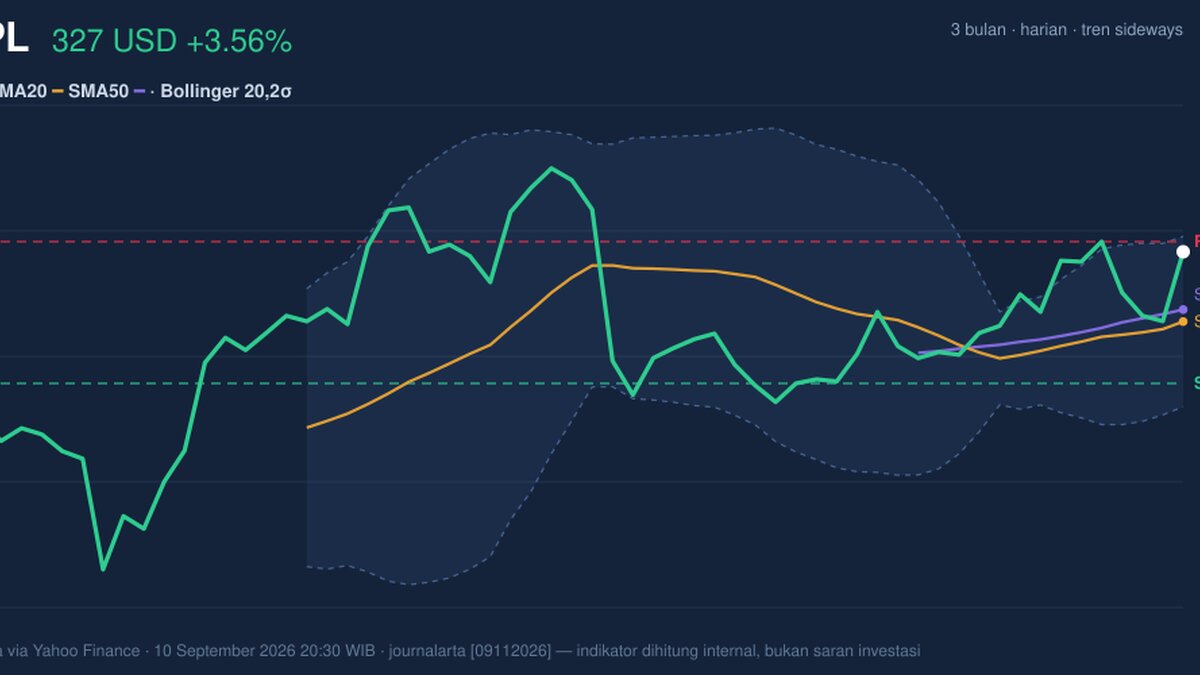
Apple Inc. (AAPL) finished at 326.57 USD on Nasdaq, up 3.56% from the previous close of 315.34, with the move reported through exchange-linked market data at 10 September 2026 20:30 WIB. The stock is pressing against the upper end of its recent range. That matters because it shows buyers are still active, but they are now running into a ceiling that has started to matter in the chart.
Trend & Price Action
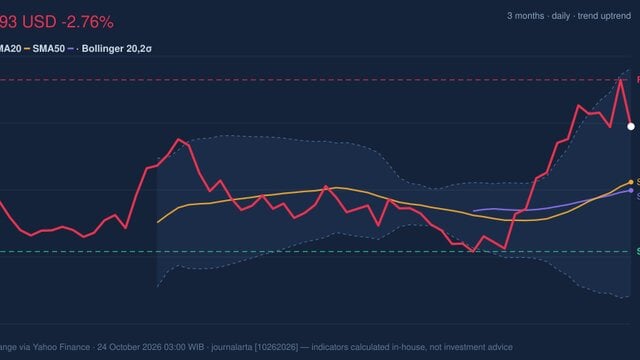
As shown in the chart, AAPL is still in a sideways trend, not a clean uptrend or downtrend, even though the price sits above SMA20 at 315.28 and also above SMA50 at 317.22. That positioning tells a simple story: the medium-term trend has improved enough to keep price above both key averages, but the market has not yet produced the kind of sustained directional break that would mark a stronger regime shift.
The absence of a fresh MA-cross reinforces that point. A moving-average cross is often used to identify a change in trend direction; without one, the chart is more about gradual repair than decisive breakout. The SMA20 slope of 1.04% over 5 days does show upward tilt, which is constructive, but it is still consistent with a market that is grinding higher rather than accelerating.

Price is also sitting at 93% of its 20-hour range, with support at 305.26 and resistance at 328.21. That placement near the top of the band means the market has already done much of the short-term work; the next move depends less on momentum from the low end and more on whether buyers can absorb supply near resistance. The broader 3-month range, from 273.75 to 344.57, shows there is still room above current levels, but the stock is no longer cheap within that window.
Oscillators & Momentum

The momentum picture is mixed but leaning positive. RSI at 58.9 is neutral, which means the stock is neither stretched nor weak on a classic momentum basis. That is important: RSI is not screaming exhaustion, so the rally is not yet technically overextended from that measure alone.
Stochastic tells a sharper story. %K at 82.2 versus %D at 52.0 places the indicator in overbought territory. In plain language, this does not mean price must fall; it means the stock has moved quickly enough that near-term upside can become harder to sustain without a pause. When Stochastic is overbought while RSI remains neutral, it often signals a market that is strong but vulnerable to consolidation rather than a clean trend reversal.
The MACD reading is the most supportive part of the momentum set. With MACD at 2.379, above the signal line at 1.598, and a positive histogram of 0.781, the indicator says trend momentum is still expanding. In practical terms, MACD above signal usually means buyers remain in control of the intermediate move, and the positive histogram shows that the gap between the two lines is still favoring the upside.
Volatility & Volume
Bollinger Bands help frame whether the move is stretched or compressed. AAPL is trading near the upper band at 329.06, with the middle band at 315.28 and the lower band at 301.49. The stock’s %B of 91% means price is sitting very close to the top of the envelope, which usually reflects strong short-term demand but also a heightened chance of cooling off if buyers fail to extend the move. The 8.7% band width is described as normal, so this is not a volatility squeeze that typically precedes a dramatic expansion; instead, it is a steady market with room to move, but not a coiled spring.
Volatility is also moderate in absolute terms. ATR(14) at 7.52, or 2.3% of price, suggests the stock can still move meaningfully in a day, but not in a disorderly way. That matters around resistance: a move through 328.21 would need enough participation to overcome ordinary daily noise.
Volume confirms that participation is real. Last volume came in at 69,925,100, about 1.7× the 20-hour average of 42,010,600, while OBV is rising. Rising OBV means volume has generally supported price advances rather than fading on rallies, which is a constructive sign because it suggests the latest move is not just a thin, low-liquidity push. In other words, the market is voting with size, not just with price.
Key Levels & Scenarios
The immediate battleground is clear: resistance at 328.21 and the Bollinger upper band at 329.06. These levels sit close together, so they form a tight overhead zone. If the stock can clear that area with volume, the chart would begin to leave the current sideways structure behind. If it fails there, the most likely result is a pullback toward the middle band and the moving averages near 315.28 to 317.22.
On the downside, support at 305.26 is the key floor from the 20-hour range, and it also sits above the lower Bollinger band at 301.49. A break below that zone would weaken the current constructive setup and suggest the recent advance was more of a short-term extension than a durable trend improvement. The fact that price is already near the top of the range makes this support especially important: once a market is this high in its band, losing the floor can trigger faster unwinding than the headline move alone would suggest.
Technical Verdict: HOLD (wait & see)
HOLD (wait & see) because the chart is constructive but not yet decisive: MACD is positive, OBV is rising, and price remains above SMA20 and SMA50, yet Stochastic is overbought and AAPL is already near resistance at 328.21 and the upper Bollinger band at 329.06. The setup favors continuation only if buyers can prove they can absorb supply at the top of the range.
- Ideal Entry Range: 315.28 to 317.22, near the SMA20/SMA50 area if price pulls back without breaking trend support.
- Exit Target: 328.21 to 329.06, using the resistance zone and upper Bollinger band as the nearest technical ceiling.
- Stop Loss Protection: below 305.26, where the 20-hour support would fail and the short-term structure would weaken.
Verdict invalidated if price breaks below 305.26. For non-traders, this means the stock is technically healthy, but it is now close enough to resistance that the market needs to prove it can keep climbing before the next leg is trusted.
The next scheduled test is whether AAPL can close decisively above 328.21 and 329.06, or whether the overbought stochastic reading forces a pause first.
Summary Data AAPL
| Last price | 326.57 USD |
| Change 1 day / 5 days / 1 month | 3.56% / 0.50% / 8.05% |
| Trend / MA-cross | sideways / none |
| SMA20 / SMA50 | 315.28 / 317.22 |
| RSI (14) / Stochastic %K | 58.9 / 82.2 |
| Bollinger %B / ATR | 91% / 7.52 |
| Support / Resistance 20 days | 305.26 / 328.21 |
| Data as of | 10 September 2026 20:30 WIB |
Track AAPL stock price daily: live levels, support/resistance and our full AAPL analysis history.