MA Testing Key Resistance: Stock Gains 2.23% (Juli 28, 2026)
On Juli 28, 2026: price 551.71 USD, trend uptrend, RSI 63.6, support 509.64, resistance 551.71. technical analysis of ma stock. MA Testing Key Resistance —…

Mastercard Inc. was last quoted at 551.71 USD on the NYSE, up 2.23% from the previous close, according to Yahoo Finance data for 27 July 2026 20:30 WIB. The move leaves the payments group pressing against the upper edge of its recent range, a position that matters because it often tells traders whether momentum is still being carried by buyers or is starting to run into supply. In Mastercard’s case, the chart shows a stock that is still in an uptrend, but one that is now testing how much enthusiasm remains after a strong month.
Trend & Price Action
The first signal is structural: Mastercard is trading above both the SMA20 at 533.25 and the SMA50 at 508.39, which keeps the medium-term trend pointed higher. The SMA20 slope of 2.28% over five days confirms that the shorter trend is still rising rather than flattening out. That is important because a rising short average usually means pullbacks are being bought faster than they are being sold. There is no fresh MA-cross, so this is not a new trend ignition story; instead, it is a continuation phase, where the stock is trying to hold gains rather than break out from a fresh technical signal.
The price is also sitting at the top of its recent band, with the 3-month high at 553.89 only a little above the last print and the 3-month low at 464.52 far below. That means the market has already done most of the heavy lifting in the past quarter, and the question now is whether it can extend into new highs or whether the pace of the rally becomes harder to sustain.
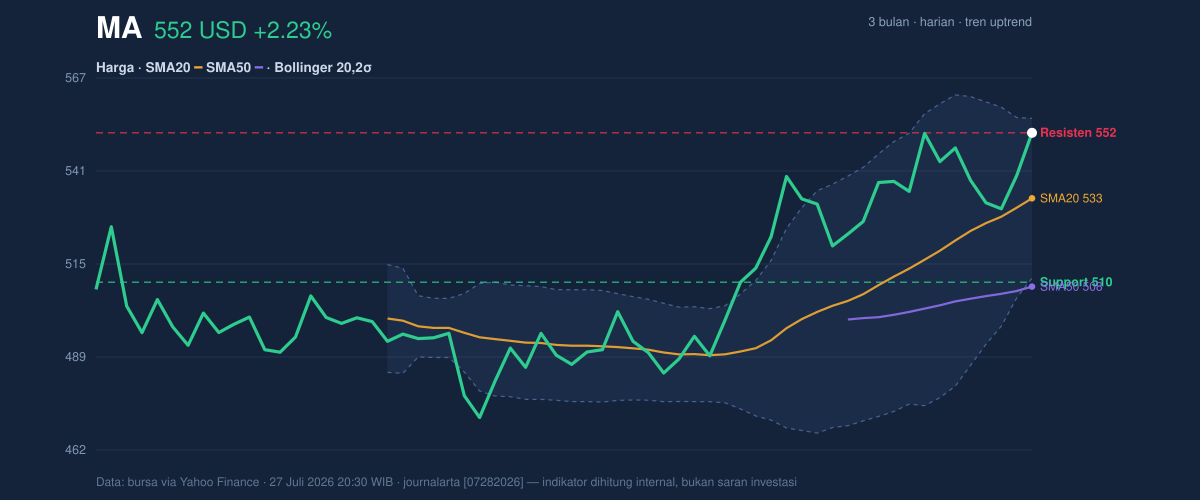
One line matters here: the stock is no longer cheap within its own range.
The Bollinger Bands, which frame where price is stretched relative to its recent average, show Mastercard trading near the ceiling. The upper band at 555.75 is close to the last price, while the %B reading of 91% says the stock is near the top of the band, not in the middle. In plain English, that means the market is pricing in a lot of optimism already. The 8.4% band width is normal, so this is not a volatility breakout regime; it is more of a steady climb with price now approaching a level where momentum often becomes more selective.
Oscillators & Momentum
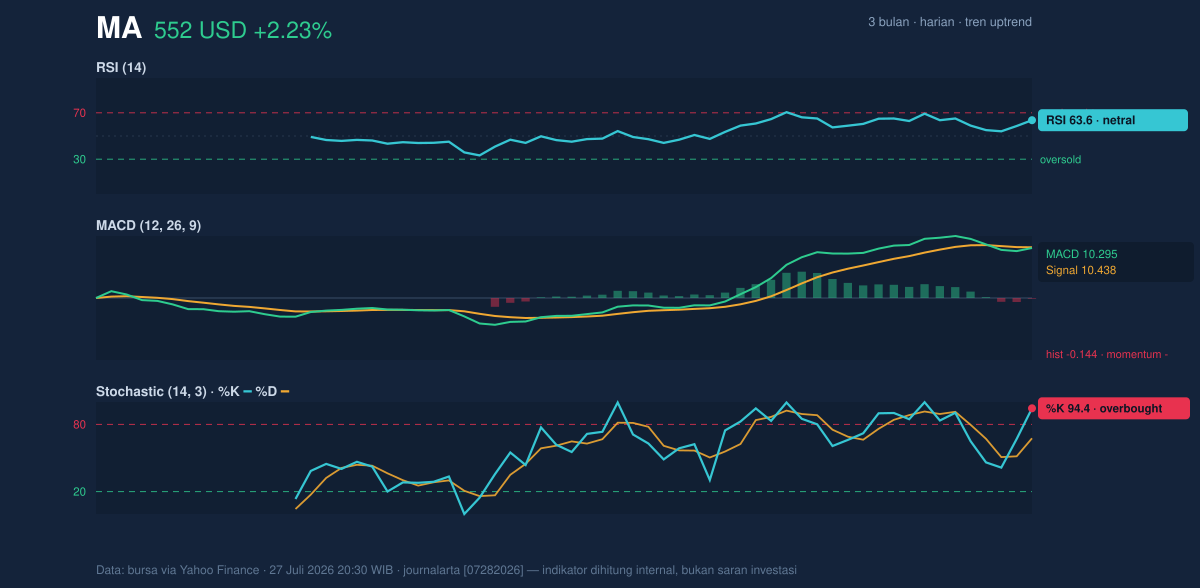
Momentum is where the picture becomes more nuanced. The RSI at 63.6 is still technically neutral, but it is leaning toward the stronger end of the scale. That usually signals healthy participation without a full overbought warning. By contrast, the Stochastic %K at 94.4 and %D at 67.6 are in overbought territory, which means the stock has been closing near the top of its recent trading range. That is often what strong trends look like late in an advance, but it also raises the odds of pause or consolidation if buyers stop chasing.
The MACD at 10.295 sits just below its signal line at 10.438, with a histogram of -0.144. That is a small but notable loss of upward momentum. MACD is a trend-following tool, so when it slips under its signal line while price is still elevated, it often suggests the rally is intact but no longer accelerating. In other words, the trend is still alive, yet the engine is not revving as hard as it was.
The signal mix is not bearish, but it is less clean than the price trend alone suggests.
Volatility & Volume
Volatility remains moderate, not explosive. The ATR at 11.37, equal to 2.1% of price, implies a normal daily swing for a large-cap name rather than a disorderly move. That matters because a stock trading near resistance with moderate ATR can either grind through a ceiling or stall and rotate lower; it does not have the kind of volatility backdrop that forces a decisive move on its own.
Volume, however, is not fully confirming the latest push. The last session’s 2,365,000 shares traded versus a 20-day average of 3,119,040, or 0.8× normal. That tells you the advance is not being powered by exceptional participation. A rally on lighter-than-average turnover can still work, but it is usually less convincing than one backed by broad trading activity. The counterweight is that OBV is rising, which suggests the broader accumulation trend has not broken down. So while the latest session was not volume-heavy, the underlying flow of shares has still been net supportive.
Key Levels & Scenarios
The chart’s most important reference points are clear. Immediate resistance sits at 551.71, which is also the last price, meaning Mastercard is effectively at the edge of the level it must clear to keep extending the move. Just above that, the 3-month high at 553.89 is the next visible hurdle. On the downside, the key support is 509.64, which is also the lower boundary of the recent 20-hour range.
If the stock can hold above the current band and push through the 3-month high, the chart would shift from an extended trend into a genuine breakout attempt. If it fails to clear that zone, the more likely result is a cooling phase back toward the middle of the Bollinger structure near 533.25, where the trend could reset without breaking.
Technical Verdict: HOLD (wait & see)
HOLD (wait & see) fits the technical setup because Mastercard is still in an uptrend, but momentum is mixed and price is already pressing resistance.
- Trend remains constructive: price is above the SMA20 at 533.25 and SMA50 at 508.39, with a rising SMA20 slope of 2.28%.
- Momentum is stretched but not fully supportive: Stochastic is overbought and MACD is below signal, which argues for caution near the highs.
- Participation is mixed: OBV is rising, but the latest volume is only 0.8× normal, so the push lacks strong confirmation.
- Verdict invalidated if price falls below 509.64, because that would break the stated support and weaken the trend structure.
- Ideal entry range: 533.25 to 551.71, where the stock would either retest support or prove it can hold above the breakout area.
- Exit target: 553.89, the 3-month high, with the upper Bollinger area at 555.75 as the nearby technical ceiling.
- Stop loss protection: 509.64, below the recent support and the lower edge of the short-range structure.
For non-traders, this means Mastercard is still strong, but it is close enough to resistance that the next move matters more than the last one.
“Right now the chart is asking whether buyers still have the conviction to pay up again.”
Summary Data MA
| Last price | 551.71 USD |
| Change 1 day / 5 days / 1 month | 2.23% / 0.78% / 10.56% |
| Trend / MA-cross | uptrend / none |
| SMA20 / SMA50 | 533.25 / 508.39 |
| RSI (14) / Stochastic %K | 63.6 / 94.4 |
| Bollinger %B / ATR | 91% / 11.37 |
| Support / Resistance 20 days | 509.64 / 551.71 |
| Data as of | 27 Juli 2026 20:30 WIB |

