Momentum Gains, BP Stock Drops 3.89% Today
On Juli 28, 2026: price 534.30 GBp, trend sideways, RSI 65.9, support 455.60, resistance 555.90. technical analysis of bp stock. Momentum Gains — full details…

BP plc is trading in a technically constructive but increasingly stretched position: the shares are above key moving averages, momentum is still positive, yet short-term oscillators are flashing the kind of overbought warning that often precedes a pause rather than an immediate breakdown.
Trend & Price Action
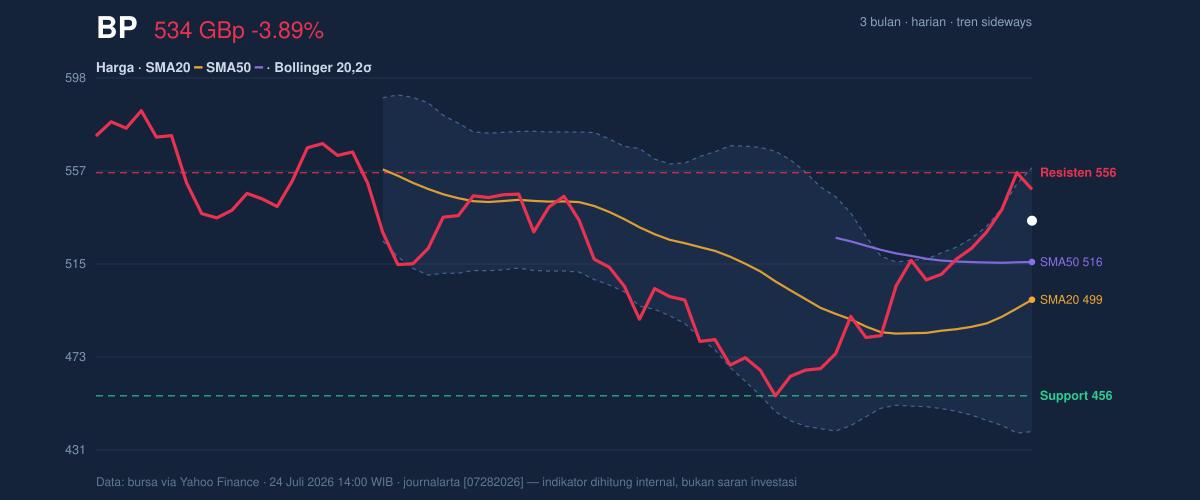
BP closed at 534.30 GBp, down from 555.90 in the previous session, but still above both the SMA20 at 498.82 and the SMA50 at 515.76. That matters because price sitting above both averages usually signals that the market is still willing to pay up for the stock even after a pullback; it suggests the recent advance has not been fully unwound. The trend is described as sideways, and that is important: it means the stock is not in a clean directional breakout, even though the SMA20 slope is rising by 2.74% over 5 days, a short-term sign that buyers have been pressing the price higher inside a broad range.
As shown in the chart, BP is trading near the upper half of its recent band rather than at an extreme breakout point. The stock is also positioned at roughly 78% of its 20-hour range, which tells readers the market has already priced in much of the recent upside. The 20-hour resistance sits at 555.90, almost exactly where the previous close landed, while nearby support is much lower at 455.60. That wide gap says the market is still in a range-trading phase, with room to move but not yet a confirmed trend extension.
Oscillators & Momentum
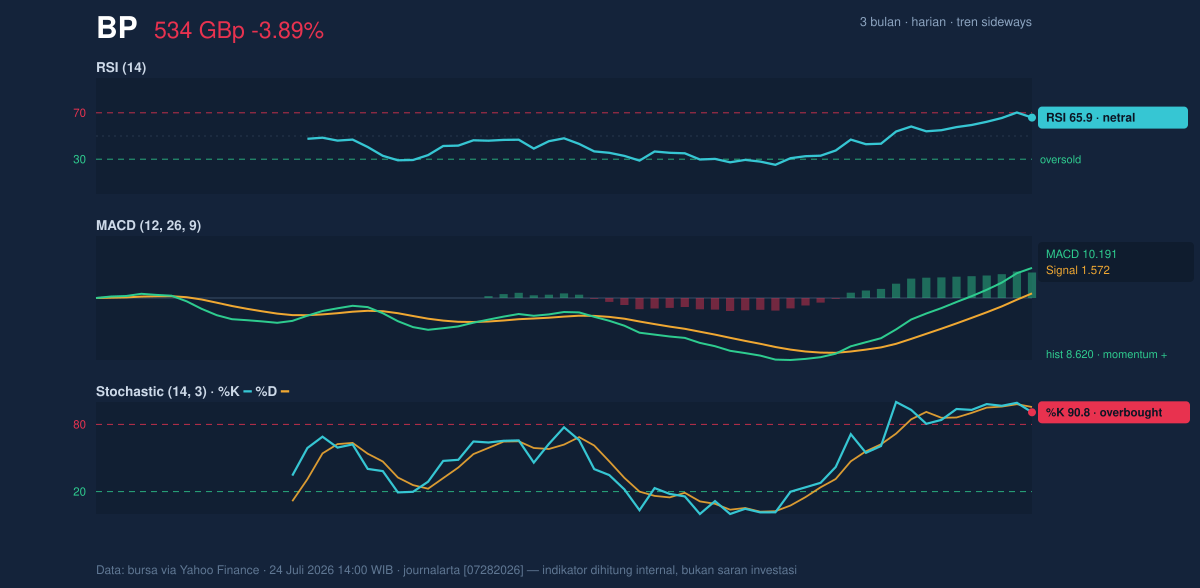
The momentum picture is mixed, and that is where the real signal sits. The RSI at 65.9 is still classed as neutral in this dataset, but it is close enough to the upper zone to show that upside enthusiasm is getting less comfortable. More telling is the Stochastic %K at 90.8 and %D at 95.5, which is clearly overbought. In plain English, that means the recent climb has been fast enough that the stock may be vulnerable to a short-term cooling-off period, even if the broader structure remains intact.
The MACD at 10.191, above its signal line at 1.572, with a histogram of 8.620, still points to positive momentum. MACD is useful because it measures whether recent price action is accelerating relative to the longer trend; here it says buyers still have the upper hand. But the combination of a strong MACD and overbought Stochastic often means the trend is healthy while the near-term pace is extended. That is not a bearish reversal by itself. It is a warning that the next move may be sideways or choppy unless volume continues to confirm the advance.
Volatility & Volume
BP’s Bollinger bands help frame how much room the shares have before the market starts to look stretched. The upper band is at 558.17, the middle band at 498.82, and the lower band at 439.47. With %B at 80%, the stock is trading closer to the top of its volatility envelope than the middle, which usually means the market is leaning bullish but may need consolidation to reset. The 23.8% band width shows the bands are widening, a sign of higher volatility. That matters because expanding bands often accompany bigger price swings, not necessarily a straight line higher.
The ATR at 13.73, equal to 2.6% of price, supports that reading: daily movement is still meaningful, but not chaotic. Volume adds a useful confirmation. The latest volume of 43,536,954 was about 1.1× normal, and OBV is rising. OBV, or on-balance volume, tracks whether trading activity is flowing into the stock or out of it; a rising reading suggests buyers are still accumulating shares on balance. That is the main reason the chart remains constructive despite the overbought oscillators.
Key Levels & Scenarios
The nearest technical ceiling is the 555.90 resistance, which also matches the previous close and sits just below the Bollinger upper band at 558.17. A clean move through that zone would tell the market is willing to accept prices at the top end of the current range, not just probe them briefly. Above that, the 3-month high at 592.00 becomes the next reference point. On the downside, the first important floor is the SMA50 at 515.76, then the SMA20 at 498.82, with deeper support at 455.60 and the 3-month low at 450.60. The distance between these levels is wide enough to show BP is still operating inside a broad trading corridor rather than a tightly coiled breakout pattern.
If price holds above the moving averages and volume stays above normal, the chart suggests BP can continue to work higher within the range. If it slips back below the SMA50, that would weaken the short-term trend and increase the chance of a return toward the SMA20. If the stock loses 498.82, the current constructive setup would begin to look more like a failed rally than a pause.
Technical Verdict: HOLD (wait & see)
HOLD (wait & see) — the trend is still supported by price above the SMA20 and SMA50, MACD remains positive, and OBV is rising, but Stochastic is overbought and price is already near the upper Bollinger band, which raises the risk of near-term consolidation. The verdict is invalidated if price breaks below 498.82.
- Ideal Entry Range: 498.82 to 515.76
- Exit Target (Target Price): 555.90 to 558.17
- Stop Loss protection: below 498.82
In plain English: BP still looks technically supported, but the stock is running hot enough that the next move is more likely to test patience than to offer a clean signal.
The next marker to watch is whether BP can close convincingly above 555.90 or slip back toward 515.76.
Summary Data BP
| Last price | 534.30 GBp |
| Change 1 day / 5 days / 1 month | -3.89% / 3.33% / 13.83% |
| Trend / MA-cross | sideways / none |
| SMA20 / SMA50 | 498.82 / 515.76 |
| RSI (14) / Stochastic %K | 65.9 / 90.8 |
| Bollinger %B / ATR | 80% / 13.73 |
| Support / Resistance 20 days | 455.60 / 555.90 |
| Data as of | 24 Juli 2026 14:00 WIB |

