Tencent Stock Drops 0.49%, Golden Cross Formed In Focus
On Juli 28, 2026: price 443.00 HKD, trend sideways, RSI 43.4, support 411.80, resistance 484.00. technical analysis of tencent stock. Tencent Stock Drops —…

Tencent Holdings slipped in Hong Kong on Friday, with the stock last changing hands at 443.00 HKD, down 0.49% from the previous close, as traders weighed a mixed technical picture that still leaves the shares below short-term trend lines even after a one-month gain. The move matters because it shows a market that is not rejecting the name outright, but is also not yet rewarding the golden cross — the point where the faster average rises above the slower one — with sustained follow-through.
Trend & Price Action
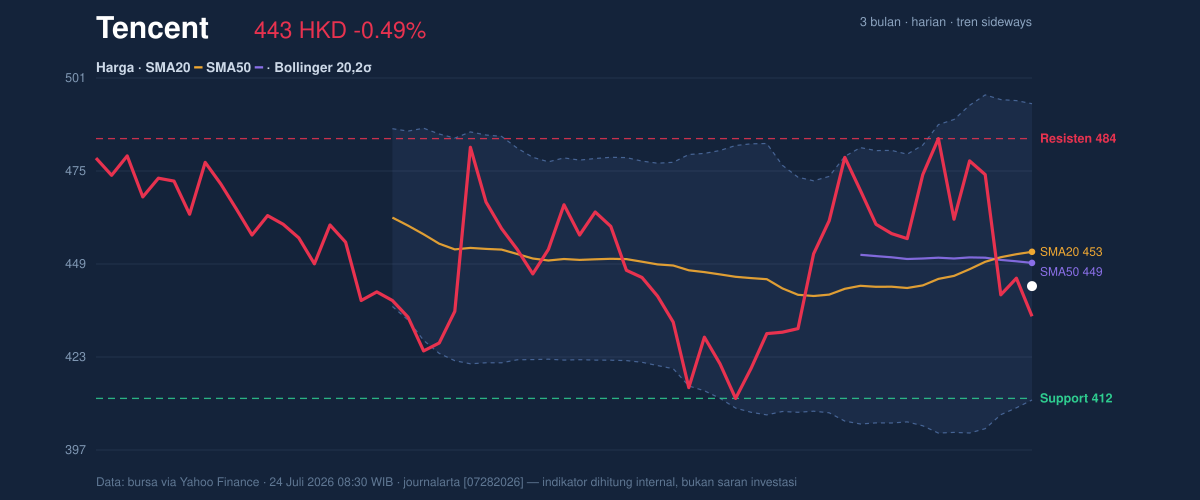
As shown in the chart, Tencent is in a sideways trend, but the details are uneven. The stock sits below its SMA20 at 452.53 and below its SMA50 at 449.46, which tells readers that recent price action has lost momentum even though the medium-term moving-average structure has improved. The presence of a golden cross is important, but in practice it is only a setup, not confirmation: when price trades beneath both averages, the signal says trend repair is possible, not yet proven. The stock also sits at 43% of its 20-hour range, closer to the lower half than the upper, which suggests buyers have not regained control after the latest pullback.
The broader range is equally revealing. Tencent’s 3-month high is 494.80 and its 3-month low is 411.00, while the key 20-hour support is 411.80 and 20-hour resistance is 484.00. That places the stock in the middle-to-lower portion of a broad band, not near a breakdown, but far from a breakout. In plain terms: the market is waiting for a catalyst, and the chart is still deciding whether the recent bounce was a pause or a pivot.
Oscillators & Momentum
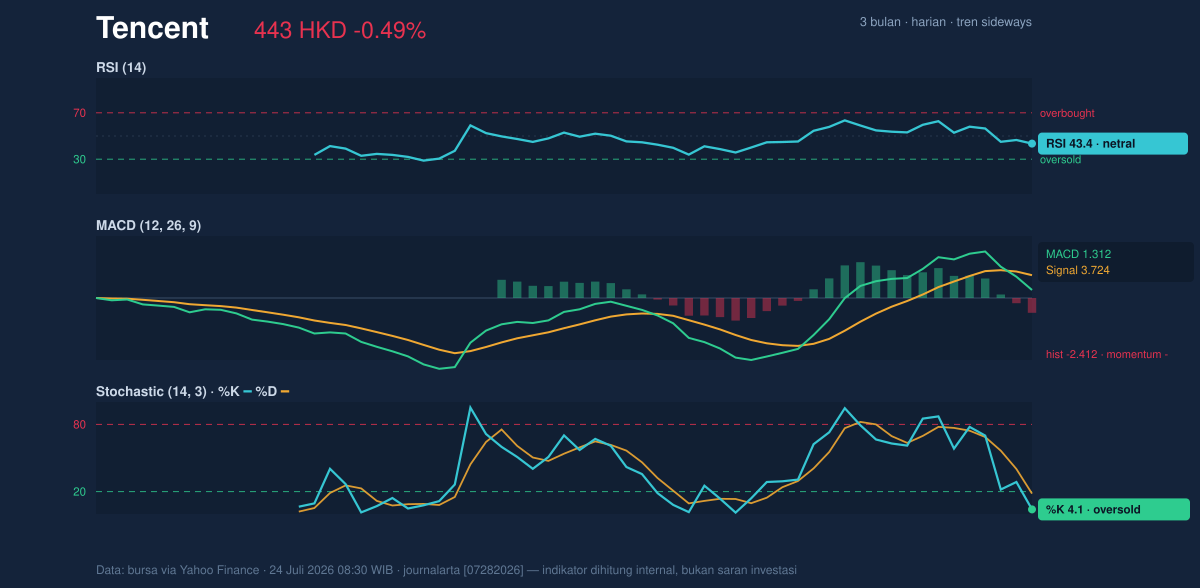
The momentum tools are split, and that split matters more than the headline trend. The RSI(14) at 43.4 is neutral, meaning the stock is neither stretched on the upside nor washed out on the downside. But the Stochastic %K at 4.1 and %D at 18.2 are in oversold territory, which signals that short-term selling has become aggressive enough to invite a rebound attempt. That said, oversold does not mean reversal is guaranteed; it only means the stock is vulnerable to a bounce if sellers pause.
The larger concern is the trend momentum indicator: MACD is 1.312 versus a signal line of 3.724, with a -2.412 histogram. That gap shows momentum is still negative, because the faster line remains below the slower signal line. In technical terms, the stock may be trying to stabilize, but the trend engine has not yet turned back up. This is why the golden cross above is not enough on its own: price, momentum, and volume are not yet aligned.
Volatility & Volume
Volatility is elevated, but not in panic mode. Tencent’s ATR(14) is 19.50, or 4.4% of price, which means the stock can move sharply even on ordinary sessions. The Bollinger Bands show the upper band at 493.71 and the lower band at 411.35, with %B at 38% and a normal 18.2% band width. That combination says the stock is not in a squeeze — there is no sign of a coiled spring waiting for a major expansion — but it is also not trading at an extreme. Price remains below the middle band at 452.53, which reinforces the idea that the market is still below its short-term fair-value pivot.
Volume is the other caution flag. Last session’s volume was 22,959,603, versus a 20-hour average of 36,647,668, or only 0.6× normal. That is weak participation for a stock trying to repair its trend. Lower volume on a down day can soften the bearish message, but the OBV is down, which means cumulative volume flow is still favoring distribution rather than accumulation. Put simply: the price has not yet attracted enough committed buying to validate the bounce case.
Key Levels & Scenarios
The chart’s structure gives two clean reference points. On the downside, 411.80 is the immediate support to watch, sitting just above the 3-month low of 411.00. A failure there would expose the lower edge of the recent range and suggest the pullback is becoming something more serious than a routine reset. On the upside, 452.53 — the SMA20 and Bollinger midline — is the first technical hurdle, followed by 484.00 resistance. A move back above the midline would improve the short-term tone; a push through resistance would be a stronger sign that the golden cross is finally gaining traction.
The key signal is simple: price is still below the averages, but not yet below the floor.
Technical Verdict: HOLD (wait & see)
HOLD (wait & see)
- MACD remains negative, with the histogram at -2.412, so downside momentum has not fully cleared.
- Price is below SMA20 and SMA50, even though the chart shows a golden cross; that means the trend improvement is real but unconfirmed.
- Stochastic is oversold and RSI is neutral, which supports a possible rebound, but volume at 0.6× normal and a down OBV argue against chasing strength too early.
- Verdict invalidated if price breaks below 411.80, because that would put the stock through immediate support and near the 3-month low of 411.00.
- Ideal Entry Range: 411.80 to 452.53
- Exit Target (Target Price): 484.00, then 493.71
- Stop Loss protection: below 411.80, with the lower Bollinger band at 411.35 as the nearby technical warning line
For non-traders: Tencent is not showing a clean breakout or a clean breakdown, so the chart is asking for patience rather than conviction.
“The market is waiting for proof, not promises.”
Summary Data Tencent
| Last price | 443.00 HKD |
| Change 1 day / 5 days / 1 month | -0.49% / -4.03% / 5.13% |
| Trend / MA-cross | sideways / golden |
| SMA20 / SMA50 | 452.53 / 449.46 |
| RSI (14) / Stochastic %K | 43.4 / 4.1 |
| Bollinger %B / ATR | 38% / 19.50 |
| Support / Resistance 20 days | 411.80 / 484.00 |
| Data as of | 24 Juli 2026 08:30 WIB |


