AstraZeneca Momentum Weakens: Stock Gains 2.13% (Juli 29, 2026)
On Juli 29, 2026: price 12,940.00 GBp, trend downtrend, RSI 45.0, support 12,364.00, resistance 14,538.00. technical analysis of astrazeneca stock.

According to data from the London Stock Exchange via Yahoo Finance, AstraZeneca (AZN.L) last traded at 12,940.00 GBp, up 2.13% on the day, but the move sits inside a broader weakening pattern. The shares are still below the 20-day SMA at 13,221.10 and below the 50-day SMA at 13,488.36, which tells the market is rallying from a lower base rather than reversing a downtrend. As shown in the chart, that matters because the stock is still trading in the lower quarter of its recent range, with room to recover only if buyers can force a cleaner break above nearby resistance.
Trend & Price Action
The clearest signal is the trend, and it remains negative. The stock is in a downtrend, with the SMA20 slope down 2.48% over 5 days, which means the short-term average is still falling rather than flattening out. That usually signals that recent buying has not yet been strong enough to change the direction of travel. The fact that price is under both the 20-day and 50-day averages also means the medium-term structure is still leaning defensive.
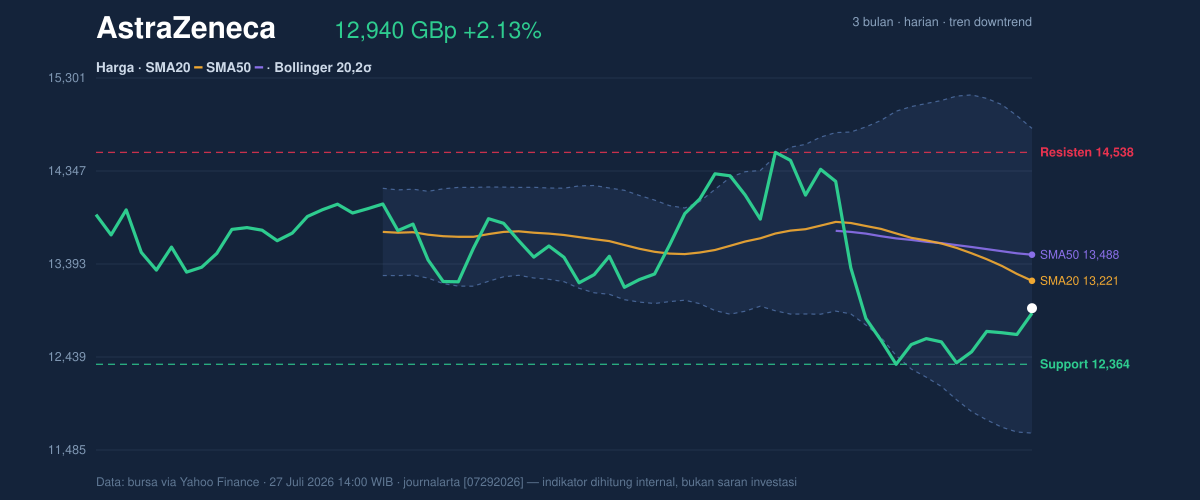
There is no fresh moving-average crossover, so the chart is not giving a clean trend-reversal signal yet. In practical terms, that means the market has not produced the kind of technical confirmation that often accompanies a durable turn. The share price is currently positioned about 26% of the way through the 20-hour range, with support at 12,364.00 and resistance at 14,538.00. That placement is important: it suggests AstraZeneca is closer to the lower end of the short-term range than the upper end, even after the day’s bounce.
The broader three-month band also frames the move. The stock’s 3-month high is 15,126.00 and the 3-month low is 9,892.00, so the current price is well above the trough but still materially below the peak. That is not a collapse, but it does show the market has not restored the earlier momentum that carried the shares toward the top of that range.
Oscillators & Momentum
Momentum is mixed, which is usually what a struggling trend looks like before it either stabilises or rolls over again. The RSI at 45.0 is neutral, meaning the shares are neither stretched upward nor deeply sold off. That matters because it leaves room for movement in either direction, but it does not, by itself, argue that the recent bounce is powerful enough to override the broader downtrend.
The Stochastic %K at 67.7 and %D at 62.9 is also neutral, though it sits closer to the upper half of the range, which hints at short-term recovery interest. Still, the signal is not extreme enough to suggest overbought pressure, and not weak enough to imply capitulation. The more telling indicator is the MACD at -292.790, with the signal line at -270.461 and a histogram of -22.329. That negative histogram means downside momentum remains in place even if the price has risen over the last session.
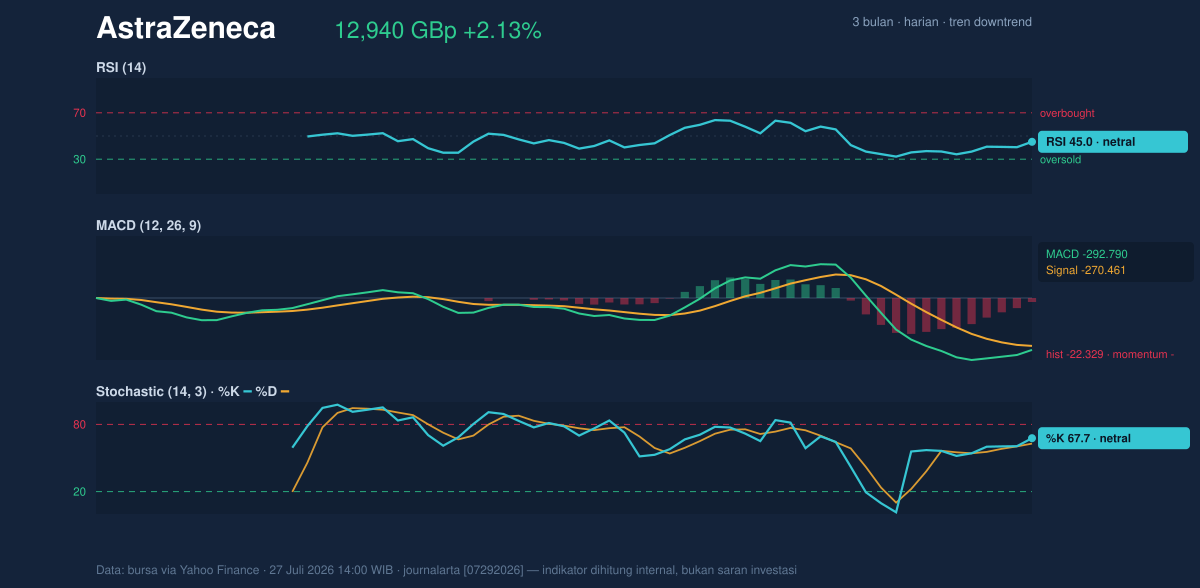
In plain language, the oscillators are not confirming a strong bullish turn. They are saying the stock has bounced, but the internal momentum underneath that bounce is still cautious. When RSI and Stochastic are neutral while MACD remains negative, the market is typically in a transition phase rather than a decisive trend change.
Volatility & Volume
Volatility is elevated. The Bollinger Bands are wide, with the upper band at 14,783.55, the middle band at 13,221.10, and the lower band at 11,658.65. The band width of 23.6% signals expansion rather than compression, which usually means the stock is capable of larger swings in either direction. The current price sits below the middle band, so the market is still trading on the weaker side of the volatility envelope.
The %B at 41% shows price is below the midpoint of the band structure, another sign that the rebound has not yet reclaimed the centre of gravity. The ATR(14) at 750.94, equal to 5.8% of price, reinforces that message. ATR is a measure of typical daily movement, so a reading this high means traders should expect wider intraday ranges than normal. That often makes breakouts more decisive, but it also makes false starts more common.
Volume does not yet confirm a major shift. Last volume was 2,548,927, almost exactly in line with the 20-day average of 2,561,433, or 1.0x normal. In other words, the day’s gain was not accompanied by a surge in participation. The OBV is falling, which is a classic warning sign: on-balance volume tracks whether volume is accumulating on up days or draining away on down days. A declining OBV suggests that, beneath the surface, sellers have had the stronger footprint over time.
Key Levels & Scenarios
The market now has a clear set of reference points. Support at 12,364.00 is the first level that matters because it sits close to the current price and marks the lower edge of the recent short-term structure. If that level gives way, the next technical cushion is the lower Bollinger band at 11,658.65, which would indicate the stock is moving into a more stressed part of its range.
On the upside, resistance at 14,538.00 is the first hurdle. That level is below the upper Bollinger band at 14,783.55, so a move through resistance would still need follow-through to show that the rebound is not just a short-covering bounce. The 20-day SMA at 13,221.10 is also important as an intermediate reclaim level; the stock is still below it, and getting back above that middle band would be a sign that pressure is easing.
Technical Verdict: HOLD (wait & see)
HOLD (wait & see)
- Reason 1: The stock remains in a downtrend and is still below the SMA20 and SMA50, so the trend has not yet turned.
- Reason 2: MACD is negative and the OBV is falling, which means momentum and participation are not fully supporting the rebound.
- Reason 3: Volatility is high with a 23.6% Bollinger width and ATR at 750.94, so the next move could be sharp but is not yet confirmed.
- Invalidation: This verdict is invalidated if price falls below 12,364.00, which would weaken the short-term base and expose the lower Bollinger band at 11,658.65.
Ideal Entry Range: 12,364.00 to 13,221.10
Exit Target: 14,538.00 to 14,783.55
Stop Loss protection: below 11,658.65
For non-traders, this means the shares have bounced, but the chart still needs stronger proof before the move can be treated as a real trend change. AstraZeneca’s next technical test is 14,538.00.
Summary Data AstraZeneca
| Last price | 12,940.00 GBp |
| Change 1 day / 5 days / 1 month | 2.13% / 4.52% / -9.50% |
| Trend / MA-cross | downtrend / none |
| SMA20 / SMA50 | 13,221.10 / 13,488.36 |
| RSI (14) / Stochastic %K | 45.0 / 67.7 |
| Bollinger %B / ATR | 41% / 750.94 |
| Support / Resistance 20 days | 12,364.00 / 14,538.00 |
| Data as of | 27 Juli 2026 14:00 WIB |



