Golden Cross Formed, Tencent Stock Gains 2.90% Today
On Juli 29, 2026: price 447.20 HKD, trend sideways, RSI 46.6, support 420.20, resistance 484.00. technical analysis of tencent stock. Golden Cross Formed —…

Tencent Holdings fell back in Hong Kong on 27 July 2026, with the stock last changing hands at HKD 447.20, up 2.90% from the previous close of 434.60, even as the broader technical picture still points to a market that is trying to stabilise rather than break out decisively.
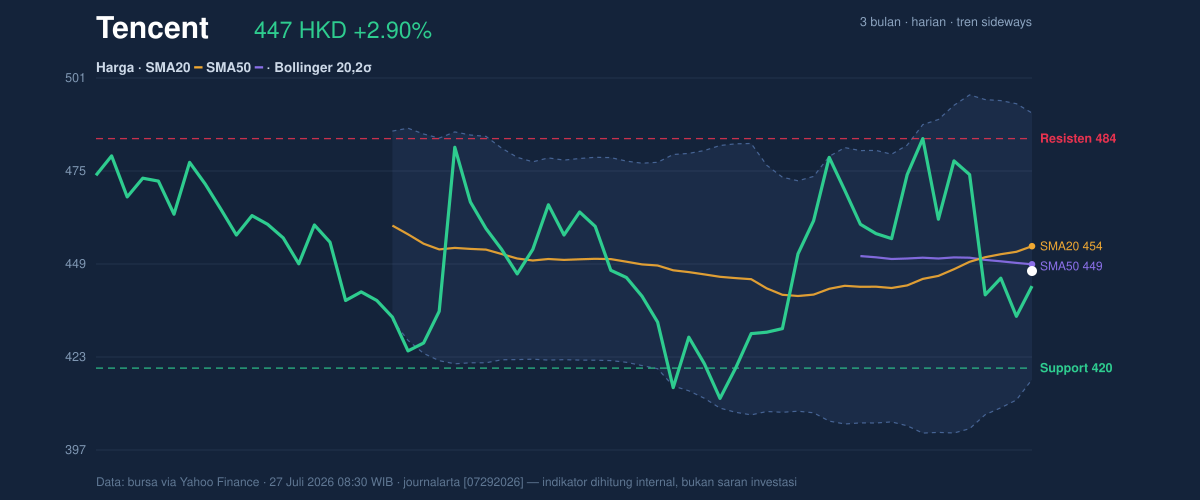
The move matters because it came after a weak 5-day stretch of -6.40%, which tells traders the rebound is happening inside a larger pullback, not after a clean trend reversal. The stock is still trading below its SMA20 at 454.09 and just under its SMA50 at 449.07, while the chart shows a golden cross — the 20-day average has moved above the 50-day average. That combination is important: the crossover is a medium-term bullish signal, but the fact that price sits below both averages means the signal has not yet been fully confirmed by the market. In plain terms, the trend has improved on paper, but price action has not fully caught up.
Trend & Price Action
As shown in the chart, Tencent is still in a sideways phase, with the SMA20 slope up 1.43% over 5 days. That rising short-term average suggests buyers have started to lean in again, but the stock remains in the middle of its recent range rather than pressing into the upper band. The last price is sitting at about 42% of the 420.20 to 484.00 range, which signals balance rather than control: neither bulls nor bears have forced a decisive break.
The broader range reinforces that view. Tencent’s 3-month high is 494.80 and the 3-month low is 411.00, so current trading is closer to the lower half of that corridor than to the top. That usually means the market is still deciding whether a rebound has enough conviction to challenge resistance.
A short punchy read: the trend is improving, but it has not yet won.
Oscillators & Momentum
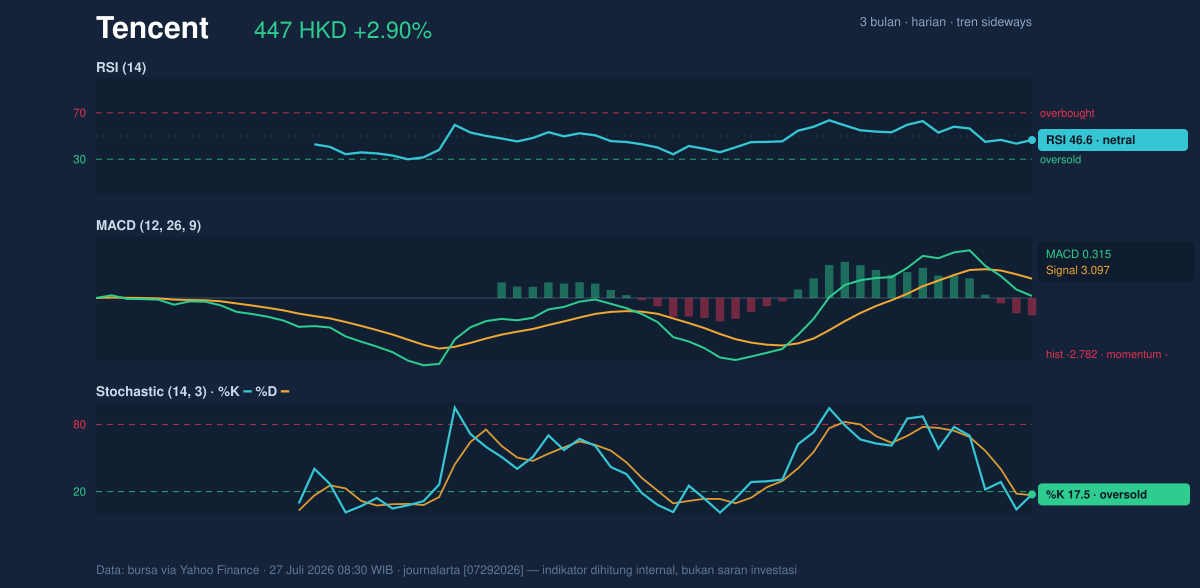
The momentum gauges are split, and that split is the story. The RSI at 46.6 is neutral, which means Tencent is neither overbought nor oversold on a broad momentum basis. But the Stochastic %K at 17.5 and %D at 16.7 are both in oversold territory, suggesting the recent drop may have gone far enough to attract short-term bargain hunters. That is a near-term recovery signal, not a guarantee of follow-through.
The more cautious message comes from the moving-average convergence/divergence reading: MACD 0.315 versus signal 3.097, with a histogram of -2.782. When the histogram is negative, it means the faster line is still below the slower signal line, so downside momentum remains in place even if price has bounced. Put simply, the stock may be oversold in the short run, but the broader momentum engine is still running weak.
That is why the rebound looks tentative, not convincing.
Volatility & Volume
Tencent’s Bollinger Bands show the stock trading below the middle line at 454.09, with the upper band at 491.14 and the lower band at 417.04. The %B at 41% places price below the centre of the band structure, which usually indicates the stock is recovering from a weak patch but has not yet regained full strength. The 16.3% band width is described as normal, so this is not a squeeze that often precedes a violent breakout; instead, it points to a market that can move, but without an obvious volatility compression setup.
The ATR(14) at 18.36, or 4.1% of price, says volatility is still high. That matters because it means any move through support or resistance may happen quickly once volume appears. For now, volume is the missing ingredient: last turnover of 14,454,552 shares was only 0.4× the 20-day average of 35,776,751, and OBV is down. In practical terms, the bounce has not yet been backed by broad participation. A price rise on thin volume can fade fast; a genuine trend repair usually needs heavier trading, not less.
Key Levels & Scenarios
The chart’s key reference points are clear. Immediate support sits at 420.20, while immediate resistance is 484.00. Below the current price, the lower Bollinger band at 417.04 adds another important floor. Above, the 3-month high at 494.80 is the next obvious ceiling after 484.00.
The signal map is straightforward: if Tencent can reclaim 454.09 and then work toward 484.00, the golden cross would start to look more credible as a live trend signal rather than a technical curiosity. If price slips back through 420.20, the oversold bounce narrative weakens quickly, and the market would be forced to reassess the recent rebound as a temporary pause inside a larger down move. The fact that price is already below both SMA20 and SMA50 means the burden of proof still sits with the bulls.
Technical Verdict: HOLD (wait & see)
HOLD (wait & see)
- Golden cross is constructive, but price is still below SMA20 454.09 and below SMA50 449.07, so the crossover has not been confirmed by price.
- Stochastic oversold suggests short-term rebound potential, but MACD histogram -2.782 shows momentum is still negative.
- Volume at 0.4× average and OBV down mean the latest bounce lacks strong participation.
- Invalidation: this verdict is invalidated if price falls below 420.20.
- Ideal entry range: 420.20 to 454.09
- Exit target: 484.00
- Stop loss protection: 417.04
For non-traders, that means the stock is showing signs of recovery, but the market has not yet proved the rebound is real.
Tencent’s next test is whether buyers can defend 420.20 and then force a return above 454.09; as one trader might put it, “it’s trying to turn the corner, but the tape still hasn’t signed off.”
Summary Data Tencent
| Last price | 447.20 HKD |
| Change 1 day / 5 days / 1 month | 2.90% / -6.40% / 8.60% |
| Trend / MA-cross | sideways / golden |
| SMA20 / SMA50 | 454.09 / 449.07 |
| RSI (14) / Stochastic %K | 46.6 / 17.5 |
| Bollinger %B / ATR | 41% / 18.36 |
| Support / Resistance 20 days | 420.20 / 484.00 |
| Data as of | 27 Juli 2026 08:30 WIB |


