HSBC RSI Overbought: Stock Gains 0.37% (Juli 29, 2026)
On Juli 29, 2026: price 162.00 HKD, trend uptrend, RSI 75.8, support 147.60, resistance 162.80. technical analysis of hsbc stock. HSBC RSI Overbought — full…

HSBC Holdings closed at HK$162.00, up 0.37% from the previous close of HK$161.40, with the shares now sitting just below the HK$162.80 resistance and inside striking distance of the HK$163.18 upper Bollinger band. That positioning matters: the stock is not merely rising, it is pressing against the top of its recent trading envelope, which usually signals either a continuation attempt or a pause while momentum cools.
The broader pattern remains constructive. HSBC is in an uptrend, with the SMA20 at HK$154.72 above the SMA50 at HK$148.37, a classic sign that short-term price action is still leading the medium-term trend. The price trading above the SMA20 confirms that buyers have kept control of the tape over the past several sessions. There has been no fresh MA cross, so the trend is not being driven by a new technical trigger; rather, it is being sustained by persistence. The slope of the SMA20, at 1.99% over 5 days, shows that the trend is still rising at a healthy clip, but the chart also shows the shares already at 95% of the 20-day range, which is a sign of maturity rather than early-stage breakout.
Trend & Price Action
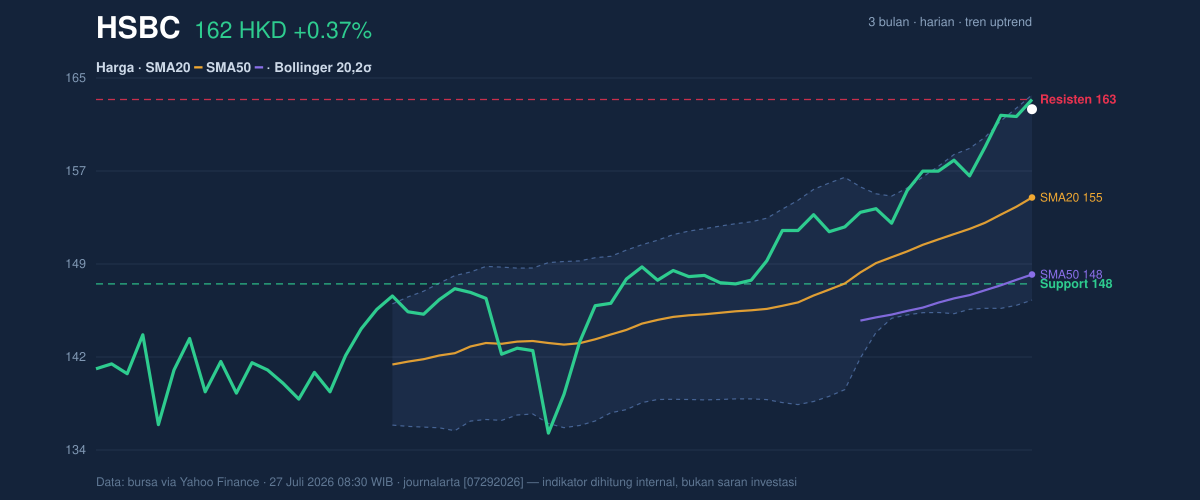
As shown in the chart, HSBC is trading near the upper end of its recent band, with the HK$147.60 support and HK$162.80 resistance framing the current setup. The stock’s proximity to the upper boundary suggests that the market has already priced in a good portion of the latest upward move. The 3-month high of HK$163.40 is only slightly above the current level, which means the shares are testing the edge of a prior ceiling rather than moving through open air. In practical terms, that often leaves little room for a clean follow-through unless fresh demand arrives.
The Bollinger structure reinforces that view. The middle band sits at HK$154.72, the same level as the SMA20, while the upper band at HK$163.18 is close enough to act as a visible cap. A %B reading of 93% means the price is hugging the top of the band; that is a bullish location, but it is also where short-term profit-taking often appears. The 10.9% band width is described as normal, so this is not a volatility squeeze that typically precedes an explosive move. Instead, the market looks orderly, with enough movement for trend continuation, but not enough compression to imply a major breakout is being coiled.
Oscillators & Momentum
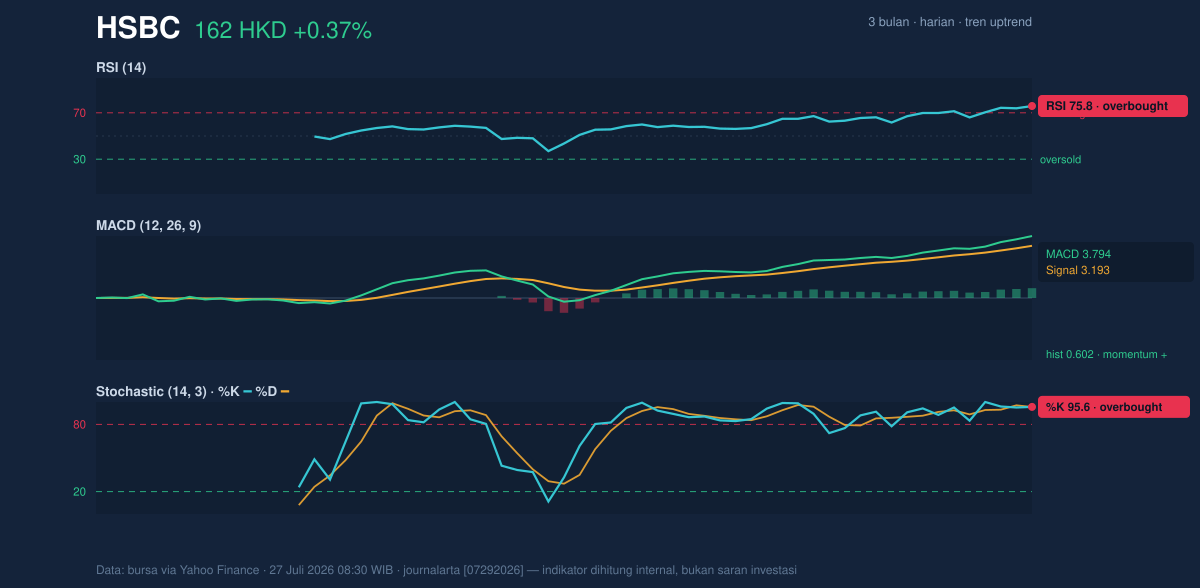
The momentum picture is strong, but stretched. The RSI at 75.8 and Stochastic %K/%D at 95.6/95.6 both sit in overbought territory, which does not automatically mean a reversal, but it does mean the stock is extended relative to its recent trading history. For readers less familiar with the term, “overbought” does not mean “bad”; it means the pace of buying has been strong enough that the market may need a pause, sideways consolidation, or a brief pullback before it can extend further. The key point is that overbought readings become more important when they appear near resistance, and HSBC is now exactly in that zone.
At the same time, the MACD at 3.794 remains above the signal line at 3.193, with a positive histogram of 0.602. That is the clearest evidence that trend momentum is still positive. MACD is essentially a measure of whether the faster trend is outrunning the slower one, and here it says the advance has not yet lost its directional edge. The result is a mixed but still bullish technical profile: price momentum is strong enough to keep the uptrend alive, while oscillators warn that the move is no longer cheap or fresh.
Volatility & Volume
Volume adds an important nuance. The latest turnover of 12,937,163 shares is running at 0.9x normal versus the 20-day average of 13,670,771. That means the share price is advancing without unusually heavy participation, which can be read two ways: either the market is quietly absorbing supply, or the move is running on less conviction than a true breakout would normally require. The OBV is rising, though, and that is an encouraging sign because on-balance volume tracks whether buying pressure is accumulating over time. In plain English, the stock is still attracting net demand even if the latest session was not a volume surge.
Volatility is moderate rather than elevated. The ATR(14) of 2.68, equal to 1.7% of price, suggests that daily movement remains contained enough for orderly trading, but wide enough that a move through resistance could still travel meaningfully in a short span. The current setup therefore looks less like a panic spike and more like a measured advance that is approaching a decision point.
Key Levels & Scenarios
If HSBC can clear and hold above HK$162.80 resistance, the chart would be probing the HK$163.18 upper Bollinger band and the nearby HK$163.40 three-month high. That combination matters because it would show the market is not just touching resistance, but attempting to convert it into support. If, however, the shares fail to hold current levels, the first technical reference is the HK$154.72 SMA20, followed by the deeper HK$147.60 support. A slip toward those levels would signal that the recent advance is being digested rather than extended.
The most important signal here is not simply that HSBC is rising, but that it is rising while momentum is stretched and volume is only moderate. That is the sort of setup that often produces either a brief consolidation or a decisive break, depending on whether buyers can keep the stock above the upper band and resistance zone.
Technical Verdict: HOLD (wait & see)
HOLD (wait & see) because the trend is still upward, MACD remains positive, and OBV is rising, but RSI at 75.8 and Stochastic at 95.6 show the shares are overbought right under HK$162.80 resistance. The setup is constructive, yet extended, and the current price is close enough to the upper Bollinger band that fresh upside needs confirmation rather than assumption.
- Ideal Entry Range: HK$154.72 to HK$162.80
- Exit Target: HK$163.18 to HK$163.40
- Stop Loss Protection: below HK$154.72, with deeper technical risk at HK$147.60
Verdict invalidated if price breaks below HK$154.72.
In plain English: HSBC is still trending higher, but it is close enough to resistance that the market now needs to prove the move can continue.
Newest hard fact: the shares last traded at HK$162.00, with the 20-day range support at HK$147.60 and resistance at HK$162.80.
Summary Data HSBC
| Last price | 162.00 HKD |
| Change 1 day / 5 days / 1 month | 0.37% / 2.66% / 9.68% |
| Trend / MA-cross | uptrend / none |
| SMA20 / SMA50 | 154.72 / 148.37 |
| RSI (14) / Stochastic %K | 75.8 / 95.6 |
| Bollinger %B / ATR | 93% / 2.68 |
| Support / Resistance 20 days | 147.60 / 162.80 |
| Data as of | 27 Juli 2026 08:30 WIB |


