HSBC Testing Key Resistance: Stock Drops 0.28% (Juli 29, 2026)
On Juli 29, 2026: price 1,548.40 GBp, trend uptrend, RSI 69.9, support 1,430.80, resistance 1,552.80. technical analysis of hsbc stock.

HSBC Holdings’ London shares were last at 1,548.40 GBp, just below the session’s 1,552.80 resistance and only a fraction under the upper Bollinger band at 1,554.62. That positioning matters because it shows the stock is pressing against the top of its recent trading envelope rather than drifting in the middle of it. The broader message from the chart is still constructive: the price remains above both the SMA20 at 1,482.39 and the SMA50 at 1,425.51, which means the medium-term trend is still pointing higher even after a modest -0.28% daily dip.
The share price has climbed 4.57% over five days and 8.75% over one month, enough to confirm that buyers have been in control for now. The slope of the SMA20, up 1.77% over five days, reinforces that message: when a short-term moving average is rising, it usually means recent prices have been strong enough to pull the trend line upward rather than the other way around. There is no fresh moving-average crossover, so this is not a new technical breakout signal; it is more a case of an existing uptrend continuing to mature. As shown in the chart, HSBC is trading near the top of its range, not yet in a clean breakout, but clearly not in a weak posture either.
Trend & Price Action
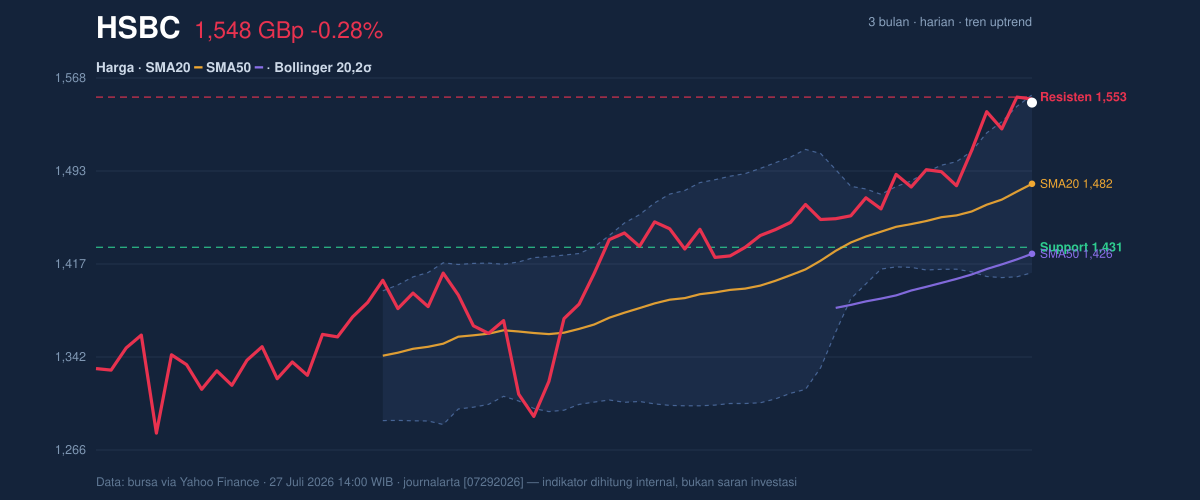
The key technical feature here is proximity to the ceiling. HSBC is sitting at 96% of its 20-hour range, with 1,430.80 as the nearest support and 1,552.80 as the nearest resistance. That tells readers two things. First, the market has already done most of the work required for a short-term advance. Second, there is limited room before the stock must either prove it can extend higher or pause and consolidate. Being near the top of the range is not bearish by itself; it simply means the burden of proof has shifted to the bulls. If the share can clear the resistance zone, the next reference point becomes the 3-month high of 1,590.00. If it fails, the chart leaves room for a pullback toward the moving-average cluster.
A short pause can be healthy.
Oscillators & Momentum
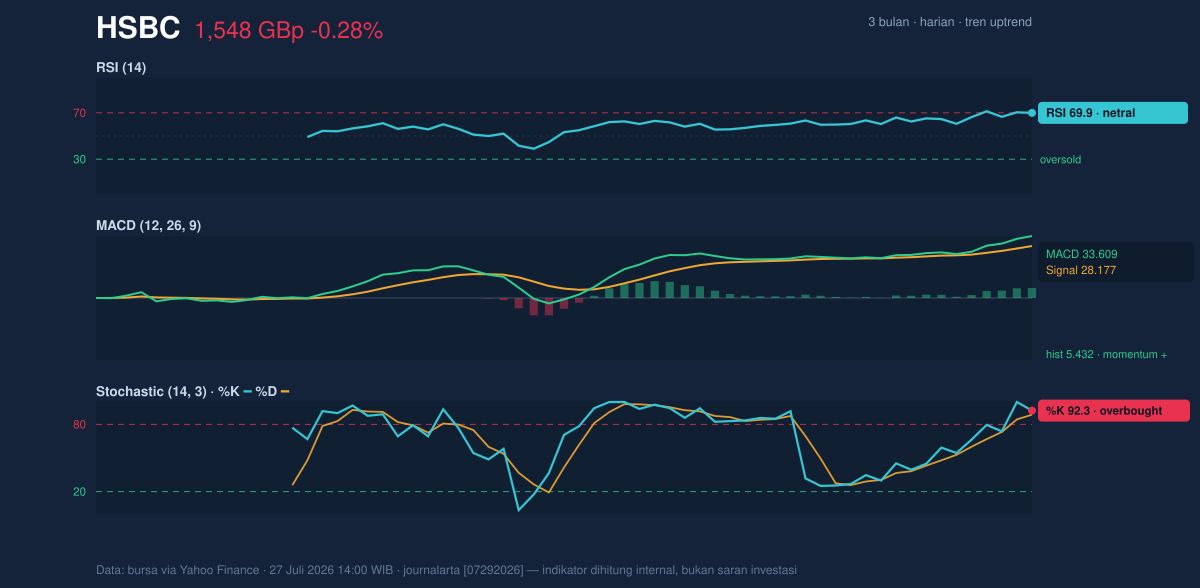
Momentum is less straightforward than trend. The RSI at 69.9 sits in neutral territory but close to the classic overbought threshold, which means the stock is not yet flashing a full exhaustion warning, though it is near the point where gains often begin to attract profit-taking. The Stochastic %K at 92.3 and %D at 88.7 is more stretched and clearly overbought, suggesting the latest push has been strong and possibly fast. In plain English, Stochastic is saying the share has been closing near the top of its recent range for long enough that short-term momentum may be overheating.
That said, the MACD at 33.609 remains above its signal line at 28.177, with a positive histogram of 5.432. This is the most important momentum confirmation in the set: it shows the trend is still being supported by underlying price acceleration, even if shorter-term oscillators are stretched. When MACD stays positive while Stochastic is overbought, the usual interpretation is not immediate reversal, but rather that the market may need consolidation before it can sustain another leg higher. The signal is “strong trend, but not cheap.”
Volatility & Volume
Volatility is neither compressed nor extreme. The Bollinger band width of 9.7% is described as normal, which argues against a volatility squeeze that might precede a sudden expansion. Instead, the market is already moving in a fairly orderly way. Price is sitting at a %B of 96%, which means it is trading very close to the upper band. That often reflects momentum, but it also warns that short-term upside is becoming more constrained unless new buying appears.
Volume gives a slightly mixed message. The latest turnover of 31,877,522 is about 1.7× the 20-hour average of 19,133,465, so the move is not happening on thin participation. That is constructive because advances backed by heavier volume are usually more credible than those built on quiet trading. Yet OBV is down, and that divergence matters: On-Balance Volume is a cumulative measure of whether volume is flowing in on up days or out on down days. A falling OBV while price is near highs can mean the price advance is outpacing the broader participation trend. In other words, traders are active, but the longer-term volume balance is not fully confirming the latest push.
Key Levels & Scenarios
The immediate technical map is clear. 1,552.80 is the first barrier to watch, and 1,554.62 from Bollinger marks the upper envelope of the current move. Above that, the chart opens toward the 1,590.00 three-month high. On the downside, 1,482.39 is the SMA20 and the Bollinger middle band, making it the first meaningful support if momentum cools. Below that, 1,430.80 is the more important floor because it is both chart support and close to the lower edge of the recent range.
If HSBC can stay above the SMA20 at 1,482.39, the uptrend remains intact. If it loses that level, the market would be signaling that the latest rally is moving from trend continuation into consolidation. If 1,430.80 fails, the technical picture would weaken materially because the stock would be slipping back into the lower part of its recent range.
Technical Verdict: HOLD (wait & see)
The verdict is HOLD (wait & see) because the trend is still positive, but short-term momentum is stretched and the stock is pressing against resistance.
Reasons:
- MACD is positive and above its signal line, which confirms the trend is still supported.
- Price is above SMA20 and SMA50, so the medium-term structure remains upward.
- Stochastic is overbought and price is near the upper Bollinger band, so the upside is extended in the short run.
Verdict invalidated if price falls below 1,430.80, which would break the nearest support and weaken the current range structure.
- Ideal Entry Range: 1,482.39 to 1,430.80
- Exit Target (Target Price): 1,590.00
- Stop Loss protection: below 1,430.80
In plain English: HSBC’s chart still points up, but the share is close enough to resistance that it looks more like a pause-and-test moment than a clean new breakout.
Summary Data HSBC
| Last price | 1,548.40 GBp |
| Change 1 day / 5 days / 1 month | -0.28% / 4.57% / 8.75% |
| Trend / MA-cross | uptrend / none |
| SMA20 / SMA50 | 1,482.39 / 1,425.51 |
| RSI (14) / Stochastic %K | 69.9 / 92.3 |
| Bollinger %B / ATR | 96% / 35.77 |
| Support / Resistance 20 days | 1,430.80 / 1,552.80 |
| Data as of | 27 Juli 2026 14:00 WIB |



