Singtel Stock Analysis: Gains 3.19%, Testing Key Resistance
On Juli 29, 2026: price 4.53 SGD, trend sideways, RSI 50.5, support 4.37, resistance 4.47. technical analysis of singtel stock. Singtel Stock Analysis — full…

Singapore Telecom’s shares on SGX rose to SGD 4.53 on 27 July 2026, up from SGD 4.39 at the previous close, as the stock pushed above its short-term moving averages and moved beyond the top of its Bollinger band, a sign that buyers are testing how far the latest rebound can run. The move is not yet a clean trend change, but it does show a stock that has shifted from a flat, range-bound posture into a more assertive short-term bid.
Trend & Price Action
The chart shows Singtel trading in a sideways trend, with the SMA20 at SGD 4.42 and the SMA50 at SGD 4.43, while the price sits above the SMA20 and just above the longer average as well. That matters because when a stock is hovering around both averages, it often signals indecision; when it moves above them, even modestly, it suggests the market is willing to pay a little more for the shares than it did over the recent month.
What stands out is that there is no new MA-cross, so this is not the kind of technical shift that usually marks a major trend reversal. Instead, the evidence points to a stock trying to build momentum inside a broader range, with the 20-day trend slope at 0.11% over 5 days indicating only a mild upward tilt. In plain terms, the trend has improved, but it has not yet escaped the sideways pattern.
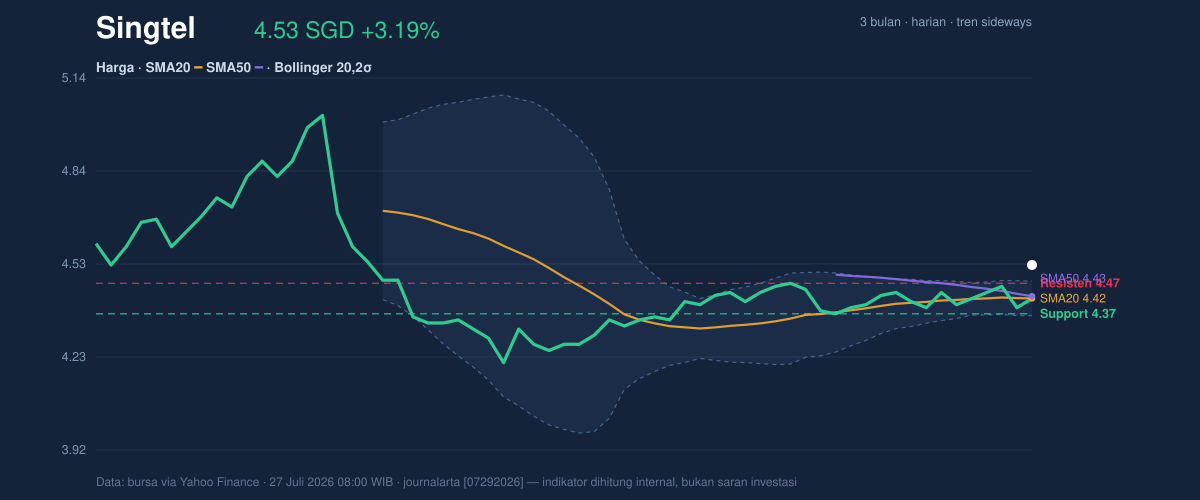
The stock is also sitting well above the recent 20-hour support at SGD 4.37 and below the 20-hour resistance at SGD 4.47, which means the latest trade is occurring above the near-term ceiling that had capped the range. That is constructive, but it also raises the question of whether the breakout can hold. The broader 3-month range of SGD 4.15 to SGD 5.05 shows there is still room for the price to recover before it approaches the upper end of its recent trading band.
Oscillators & Momentum
Momentum is mixed rather than euphoric. The RSI(14) at 50.5 is essentially neutral, which means the stock is neither overbought nor oversold; it is sitting at the midpoint where direction still needs confirmation from follow-through buying or selling. The Stochastic %K at 58.3 and %D at 58.8 is also neutral, suggesting the recent rise has not yet reached an extreme that typically warns of exhaustion.
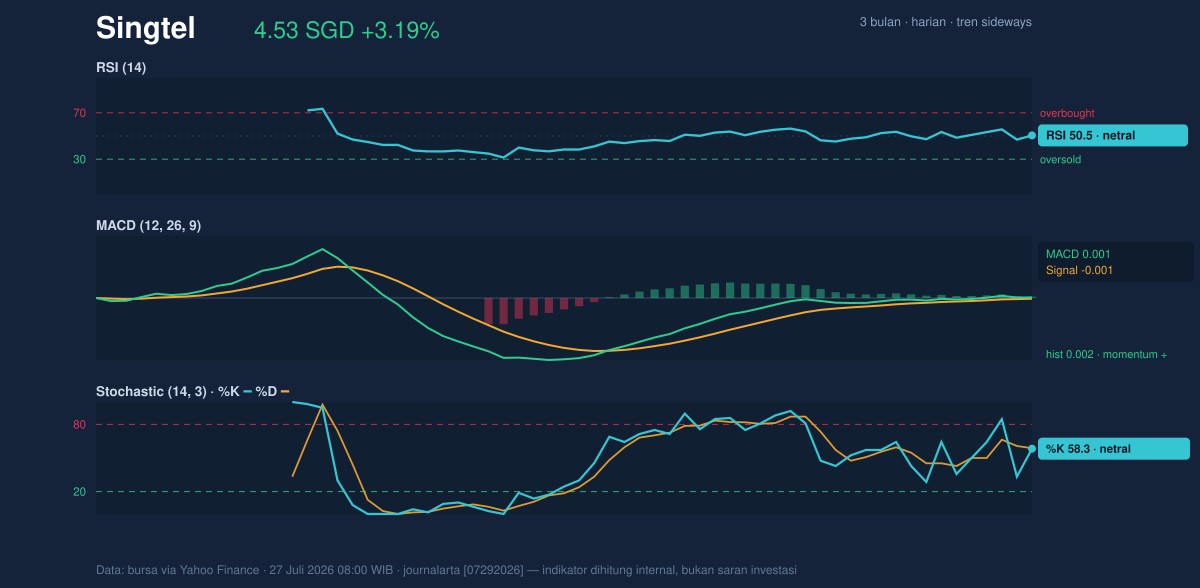
The more encouraging signal comes from the MACD at 0.001 versus signal line -0.001, with a histogram of 0.002. That combination indicates the short-term momentum line has edged above its signal line, a small but meaningful sign that upward pressure is currently stronger than downward pressure. It is not a powerful surge, but in a stock that has been stuck sideways, even a slight positive MACD turn can matter because it often appears early in a shift from consolidation toward expansion.
Volatility & Volume
The Bollinger band setup is especially important here. The upper band at SGD 4.48, middle at SGD 4.42, and lower at SGD 4.36 show the price has moved above the band ceiling, while %B at 146% indicates the stock is trading beyond the normal upper boundary of its recent range. That usually means one of two things: either the move is gaining traction and price discovery is pushing higher, or the stock is stretched and vulnerable to a quick pullback if buyers hesitate.
The band width is only 2.6%, described in the data as a squeeze, which is a useful clue. A squeeze means volatility has been compressed; markets often break out after such periods because pent-up trading interest finally resolves in one direction. So the current move above the band is more important than the percentage alone suggests, because it may be the first sign of a larger directional move rather than just a one-day overshoot.
Volume does not yet provide full confirmation. Last trading volume was 26,152,100, below the 20-hour average of 28,271,920, or 0.9× normal. That means the price rise happened without a clear surge in participation, which weakens the conviction behind the move. Still, OBV is rising, and that matters because on-balance volume tracks whether money is generally flowing into or out of the stock. A rising OBV alongside a price advance suggests accumulation is improving even if the latest session did not come with heavy turnover.
Key Levels & Scenarios
The nearest technical map is straightforward. Support at SGD 4.37 is the first line to watch, and resistance at SGD 4.47 is the level that has already been challenged. Above that, the Bollinger upper band at SGD 4.48 becomes the next reference point, while the SMA20 at SGD 4.42 and SMA50 at SGD 4.43 now act as nearby trend markers rather than overhead barriers.
If the stock remains above SGD 4.47 to SGD 4.48, the chart would suggest the squeeze is resolving upward, and the market may be accepting a higher trading range. If it slips back below SGD 4.42 to SGD 4.43, the move starts to look less like a breakout and more like another failed attempt inside a sideways market. A drop through SGD 4.37 would be the clearest sign that the latest strength has faded.
Technical Verdict: HOLD (wait & see)
HOLD (wait & see) fits best because the stock is showing improving price action, but the confirmation is still incomplete.
- MACD is positive, which supports a nascent upward shift in momentum.
- Price is above SMA20 and SMA50, showing short-term strength, but there is no new MA-cross, so the broader trend is not decisively changed.
- Bollinger bands are in a squeeze, which raises the odds of a larger move, but the latest volume came in at only 0.9× normal, so the breakout signal is not fully confirmed.
- Invalidation condition: this verdict is invalidated if price falls below SGD 4.37.
- Ideal entry range: SGD 4.42 to SGD 4.47
- Exit target: SGD 4.48, then the upper end of the recent 3-month range at SGD 5.05 if strength persists
- Stop loss protection: below SGD 4.37
In plain English, Singtel is trying to break out, but the market has not yet shown enough proof that the move is durable.
Summary Data Singtel
| Last price | 4.53 SGD |
| Change 1 day / 5 days / 1 month | 3.19% / 2.95% / 2.03% |
| Trend / MA-cross | sideways / none |
| SMA20 / SMA50 | 4.42 / 4.43 |
| RSI (14) / Stochastic %K | 50.5 / 58.3 |
| Bollinger %B / ATR | 146% / 0.07 |
| Support / Resistance 20 days | 4.37 / 4.47 |
| Data as of | 27 Juli 2026 08:00 WIB |



