HSBC Stock Analysis: Gains 1.17%, RSI Overbought
On Juli 30, 2026: price 164.70 HKD, trend uptrend, RSI 72.4, support 147.90, resistance 162.80. technical analysis of hsbc stock. HSBC Stock Analysis — full…

HSBC Holdings’ Hong Kong-listed shares closed at 164.70 HKD, up 1.17% on the day and extending a 5.24% gain over five days and 11.59% over one month, with the stock now trading above the upper edge of its recent Bollinger range at 163.80. That matters because the move is not just a one-session pop: it places the shares in a stretched but still constructive uptrend, where price is pressing into fresh highs while momentum indicators are flashing a warning that the advance may be running hot. The chart shows a market that is still being carried higher, but one that is increasingly reliant on follow-through rather than fresh bargain hunting.
Trend & Price Action
The broader structure remains positive. HSBC is trading above both SMA20 at 155.44 and SMA50 at 148.80, which means the short-term trend is still above the medium-term trend and the price is holding well over both moving averages. The SMA20 slope of 2.17% over five days confirms that near-term momentum is rising, while the lack of a new moving-average cross suggests this is not a fresh trend reversal but rather an extension of an existing one. In practical terms, that usually signals a market already in motion, with buyers still in control but less room for error if enthusiasm fades.
The price is also trading above the recent trading band. The 20-day resistance at 162.80 has already been cleared, and the shares now sit above the 3-month high of 163.40. That is a meaningful signal: when a stock pushes beyond its recent ceiling, it often means the market is repricing expectations before fundamentals even have time to catch up. But breakouts are most convincing when they happen on strong participation, and that is where this move looks less clean.
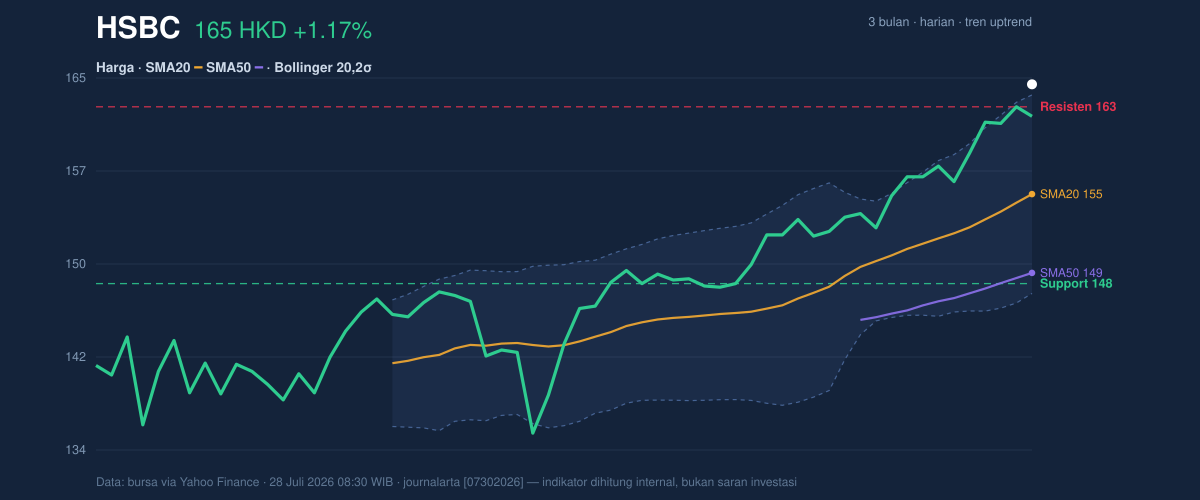
The stock is now at 113% of the 20-day range, which is a technical way of saying it is trading beyond the top of its recent range rather than in the middle of it. That usually leaves the next test to whether the breakout can hold, not just whether it can print a higher number.
Oscillators & Momentum
Momentum is strong, but also stretched. The RSI at 72.4 and Stochastic %K at 89.7 / %D at 93.5 both sit in overbought territory, which means the stock has risen fast enough that short-term traders may already be crowded on the same side. Overbought does not mean an immediate reversal; it means the market has been running hard and is more vulnerable to pauses, especially if buyers stop adding new volume. In this case, the overbought readings are not yet undermining the trend, but they do tell readers not to confuse strength with comfort.
The more encouraging piece is the MACD at 3.843 versus signal at 3.318, with a 0.525 histogram. MACD measures whether upward momentum is still accelerating relative to its own trend, and here it remains positive. That means the stock is not only above trend, it is still gaining pace beneath the surface. The tension is clear: oscillators are aligned with the uptrend, but they are also at levels that often precede consolidation.
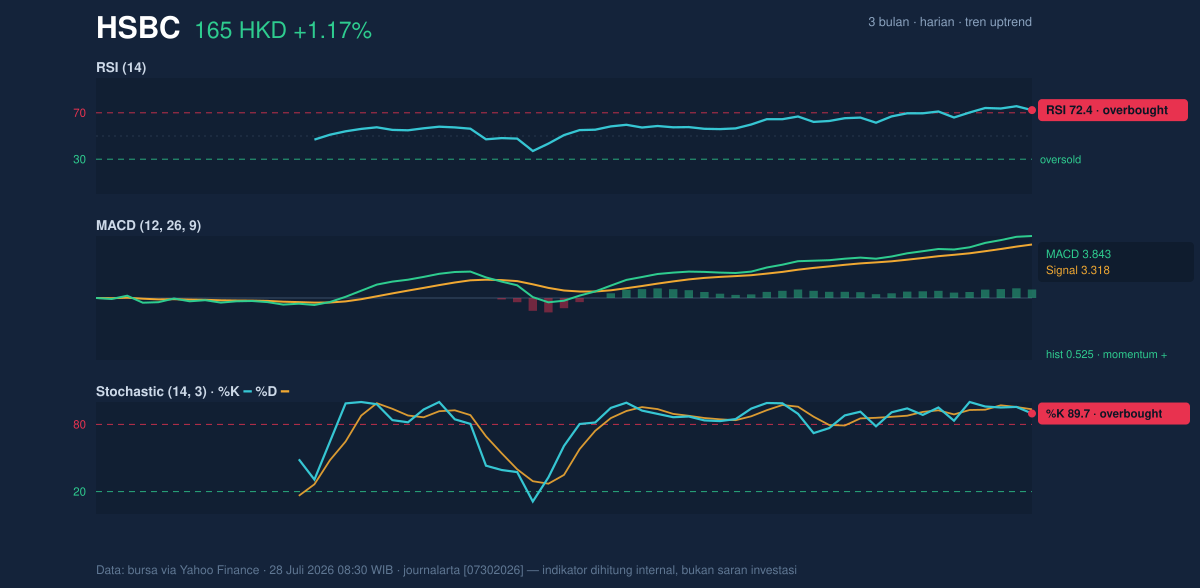
So the message from momentum is mixed in a useful way: the trend is intact, but the market is no longer cheap in technical terms.
Volatility & Volume
Volatility is moderate, not explosive. The ATR(14) of 2.58, equal to 1.6% of price, suggests typical daily swings remain manageable rather than disorderly. Meanwhile, the Bollinger Band width of 10.8% is described as normal, which implies the stock is not in a volatility squeeze that might precede a sudden expansion. In other words, the move higher is happening in a fairly ordinary volatility environment, so the breakout is being driven more by steady demand than by panic or event shock.
The volume picture is less convincing. Last volume was 8,011,395, below the 20-day average of 13,370,943, or about 0.6x normal turnover. That matters because breakouts are strongest when volume expands; thin participation can make a breakout easier to lift, but also easier to fade. Still, OBV is rising, which means cumulative volume flow continues to support the advance even if the latest session was not heavily traded. That combination often points to a market being lifted gradually rather than chased aggressively.
In plain terms: the tape is positive, but not emphatic.
Key Levels & Scenarios
The immediate technical map is straightforward. The first important floor is the 20-day support at 147.90, which sits below both moving averages and would represent a meaningful deterioration if lost. Above the market, the key reference is the 20-day resistance at 162.80, now turned into a breakout zone, while the 3-month high at 163.40 is the other nearby marker the stock has already exceeded. Since price is already above both, the market is effectively asking whether those levels become new support on any pullback.
If HSBC holds above 162.80 and stays above 163.40, the chart keeps its bullish structure intact. If it slips back below those levels while momentum cools, the move starts to look like a failed breakout rather than a fresh leg higher. The most important distinction is whether the stock can remain above prior resistance after the initial burst of enthusiasm.
The core signal is that HSBC remains in a strong uptrend, but overbought momentum and light volume mean the breakout now needs confirmation rather than applause.
Technical Verdict: HOLD (wait & see)
- RSI at 72.4 and Stochastic at 89.7 / 93.5 show the stock is overbought, so upside may be harder to sustain without a pause.
- MACD remains positive at 3.843 versus 3.318, which supports the trend and argues against a bearish call.
- Volume is only 0.6x average, so the breakout above 162.80 and 163.40 has not yet been backed by strong participation.
- Invalidation condition: this verdict is invalidated if price falls below 147.90.
- Ideal Entry Range: 162.80 to 163.40 on evidence of holding above prior resistance, or on a controlled pullback toward the upper Bollinger zone.
- Exit Target: the next move is technically unconfirmed above 164.70; the nearest reference is continued acceptance above 163.40 rather than a fixed higher level.
- Stop Loss protection: below 147.90, where the recent support structure would fail.
For non-traders, this means the shares are still strong, but the current level looks more like a checkpoint than a clean new starting point.
The latest 3-month high on the chart is 163.40 HKD.
Summary Data HSBC
| Last price | 164.70 HKD |
| Change 1 day / 5 days / 1 month | 1.17% / 5.24% / 11.59% |
| Trend / MA-cross | uptrend / none |
| SMA20 / SMA50 | 155.44 / 148.80 |
| RSI (14) / Stochastic %K | 72.4 / 89.7 |
| Bollinger %B / ATR | 105% / 2.58 |
| Support / Resistance 20 days | 147.90 / 162.80 |
| Data as of | 28 Juli 2026 08:30 WIB |



