Singtel Stock Gains 4.30%, Golden Cross Formed In Focus
On Juli 30, 2026: price 4.61 SGD, trend sideways, RSI 61.2, support 4.37, resistance 4.53. technical analysis of singtel stock. Singtel Stock Gains — full…

Singapore Telecom’s Singtel rose to SGD 4.61 on SGX on 28 July 2026, extending a short burst of strength after the previous close at SGD 4.42. The move is notable not because it is dramatic, but because it has pushed the share price above a cluster of short-term reference points that often shape trading behavior. As shown in the chart, the stock is now trading above both its SMA20 at SGD 4.43 and SMA50 at SGD 4.42, while the moving-average structure has flipped into a golden cross, a signal that the shorter trend has overtaken the longer one.
Trend & Price Action
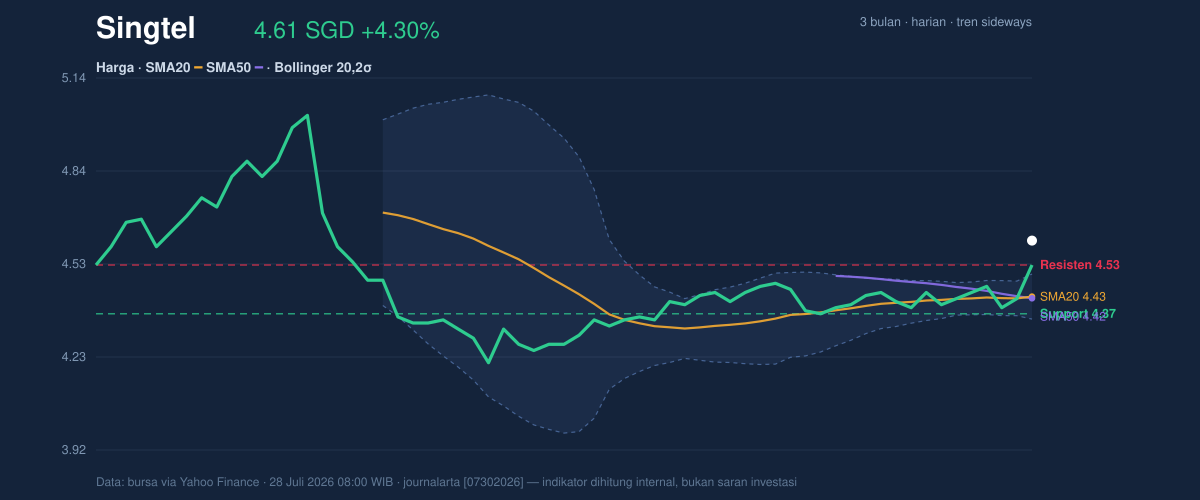
The chart shows a market that is still technically labeled sideways, but one that is leaning upward inside that range. The reason matters: the SMA20 slope is positive at 0.17% over 5 days, which means the recent drift has been improving rather than fading. In plain terms, the stock is no longer just moving sideways; it is edging higher while holding above its short- and medium-term averages.
That matters more when viewed against the recent range. Singtel is trading well above the 20-hour support at SGD 4.37 and has pushed beyond the 20-hour resistance at SGD 4.53, so the market is no longer respecting the old ceiling. The share price is also sitting far above the lower end of its 3-month range at SGD 4.15, though still below the 3-month high at SGD 5.05. That placement suggests recovery, not full trend completion.
The Bollinger Bands reinforce that reading. The upper band is at SGD 4.50, the middle band at SGD 4.43, and the lower band at SGD 4.35, with the band width at 3.3%. A narrow band usually means the market has been compressed; when price breaks above the upper band, it often signals that the compression is giving way to a directional move. Here, price is already above the upper band, and the %B reading of 174% shows the stock is trading well beyond the top of its recent volatility envelope. That can be a sign of strength, but it also means the move is extended relative to the recent pattern.
Oscillators & Momentum
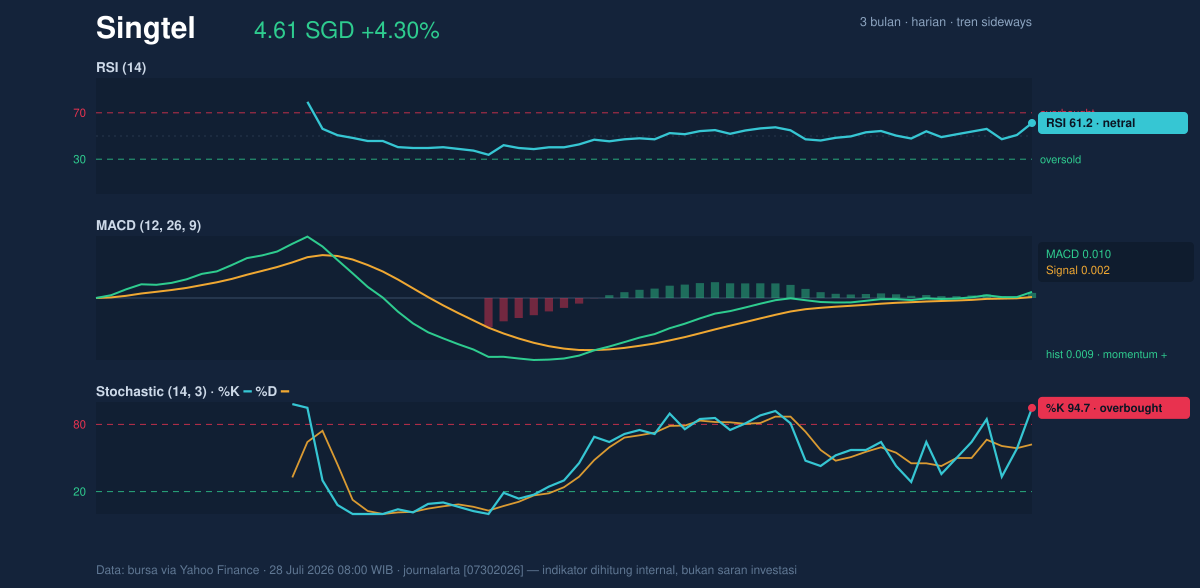
Momentum is mixed, and that combination is important. The RSI at 61.2 is still neutral, which means the stock is not yet in the kind of overheated condition that usually forces an immediate reversal. But the Stochastic oscillator at 94.7/%K and 62.1/%D is clearly overbought, showing the latest push has been fast and aggressive. In simple language, buyers have been active enough to lift the price sharply, but the move is now stretched enough that short-term pauses become more likely.
The MACD is positive at 0.010, above its signal line at 0.002, with a histogram of 0.009. That tells us the upward momentum is still intact, and the spread between MACD and signal line suggests the recent acceleration has not yet rolled over. When MACD remains positive while Stochastic is overbought, the message is usually not “trend over,” but rather “trend strong, yet vulnerable to digestion.” That is especially relevant here because the price has already outrun the upper Bollinger Band.
Volume adds a useful layer of confirmation. Trading volume reached 39,678,700, or about 1.4× the 20-day average of 28,871,885. Higher-than-normal volume on an upward move usually means the advance is being supported by participation rather than drifting on thin trade. The OBV is rising, which reinforces the idea that money flow has been leaning into the stock rather than quietly exiting it.
Volatility & Volume
The ATR(14) at 0.08, equal to 1.7% of price, points to moderate volatility. That is a useful counterweight to the strong momentum readings. The move is not occurring in a wildly unstable tape; instead, it is unfolding in a market that has enough daily movement to extend, but not enough to imply disorder. Combined with the Bollinger squeeze, this suggests the current phase may be a breakout attempt rather than a simple one-day spike.
The key signal here is that the stock is pushing upward with volume support while volatility remains contained. That is typically the kind of setup traders watch for follow-through, but it also leaves room for a pullback toward the broken resistance zone if momentum cools. Because the price is already above the upper band and the Stochastic is overbought, the next move may be less about immediate extension and more about whether the stock can hold its gains.
Key Levels & Scenarios
The most important near-term floor is SGD 4.53, the former resistance level. If that level starts acting as support, it would confirm that the breakout has been accepted by the market. Below that, SGD 4.43 to SGD 4.42 is the next technical shelf, where both the SMA20 and SMA50 sit. That zone matters because it is where trend followers will look for evidence that the golden cross is still working.
On the upside, the next obvious reference is the 3-month high at SGD 5.05. That is the clearest price landmark on the chart, and it marks the upper edge of the recent recovery structure. Between here and there, the market is still in discovery mode, but only if it can keep the breakout intact.
Technical Verdict: HOLD (wait & see)
HOLD (wait & see) is the clearest technical verdict because the chart is constructive, but the move is also stretched.
- Reason 1: Golden cross + price above SMA20/SMA50 show the trend has improved and remains supported.
- Reason 2: MACD is positive and OBV is rising, which suggests the move has participation and momentum behind it.
- Reason 3: Stochastic is overbought and price is above the upper Bollinger Band, so the advance may need time to cool before extending cleanly.
- Verdict invalidated if price falls below SGD 4.37, the 20-hour support that would weaken the breakout structure.
- Ideal Entry Range: SGD 4.43 to SGD 4.53
- Exit Target: SGD 5.05
- Stop Loss protection: SGD 4.37
In plain English, the chart says Singtel’s up-move has improved, but it is already a bit stretched and may need to prove it can hold the breakout.
Summary Data Singtel
| Last price | 4.61 SGD |
| Change 1 day / 5 days / 1 month | 4.30% / 4.30% / 4.54% |
| Trend / MA-cross | sideways / golden |
| SMA20 / SMA50 | 4.43 / 4.42 |
| RSI (14) / Stochastic %K | 61.2 / 94.7 |
| Bollinger %B / ATR | 174% / 0.08 |
| Support / Resistance 20 days | 4.37 / 4.53 |
| Data as of | 28 Juli 2026 08:00 WIB |



