Tencent Stock Technicals Today: Gains 5.28%, Golden Cross Formed
On Juli 30, 2026: price 466.40 HKD, trend uptrend, RSI 48.0, support 429.80, resistance 484.00. technical analysis of tencent stock. Tencent Stock Technicals —…

Tencent Holdings traded higher on the Hong Kong exchange on 28 July 2026, with the shares last changing hands at 466.40 HKD, up from the previous close of 443.00 HKD, as the stock pushed further into the upper half of its recent trading band. The move matters because it came while the broader technical structure still points to an uptrend, but the momentum gauges are not fully confirming the advance yet. In other words, the chart is saying the trend is intact, but the pace of the climb is not as clean as the price action alone might suggest.
Trend & Price Action
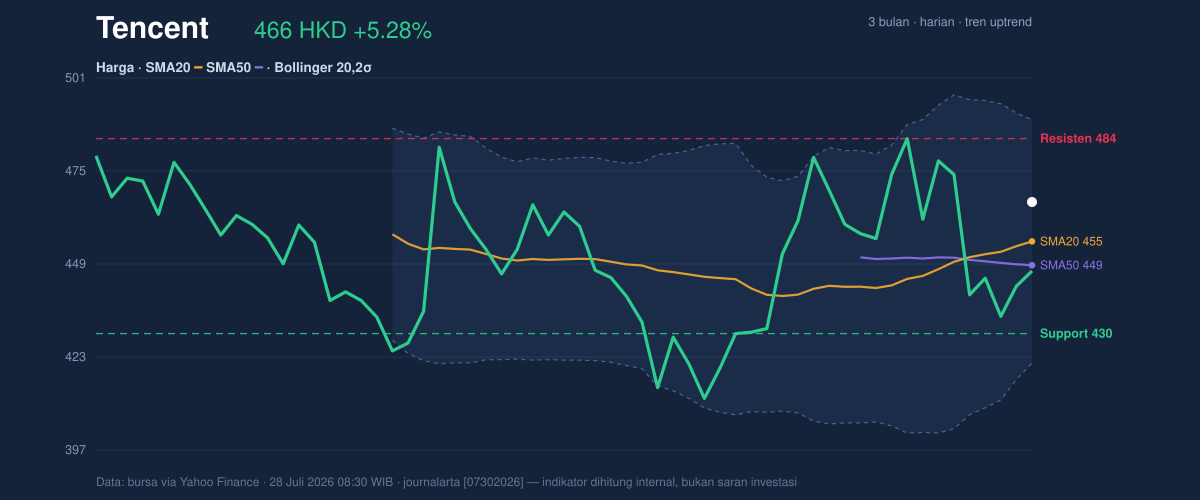
Tencent is trading above its SMA20 at 455.44 and also above the SMA50 at 448.81, which keeps the medium-term structure constructive. More importantly, the chart shows a golden cross — the SMA20 has crossed above the SMA50 — a pattern that often signals improving trend quality because shorter-term buying pressure has overtaken the longer-term average. The SMA20 slope is also rising at 1.26% over 5 days, reinforcing the idea that the trend is still pointing upward rather than flattening out.
The current price sits at 68% of the 20-hour range, which places Tencent closer to resistance than support, but not yet at an extreme. That positioning is important: it means buyers have kept control, yet there is still room for the stock to test overhead supply before the chart becomes overextended. The 3-month high at 494.80 is the obvious ceiling in the broader range, while the 3-month low at 411.00 marks the lower boundary of the recent structure.
A stock can be rising and still be vulnerable if it is running into resistance without volume. Tencent is there now.
Oscillators & Momentum
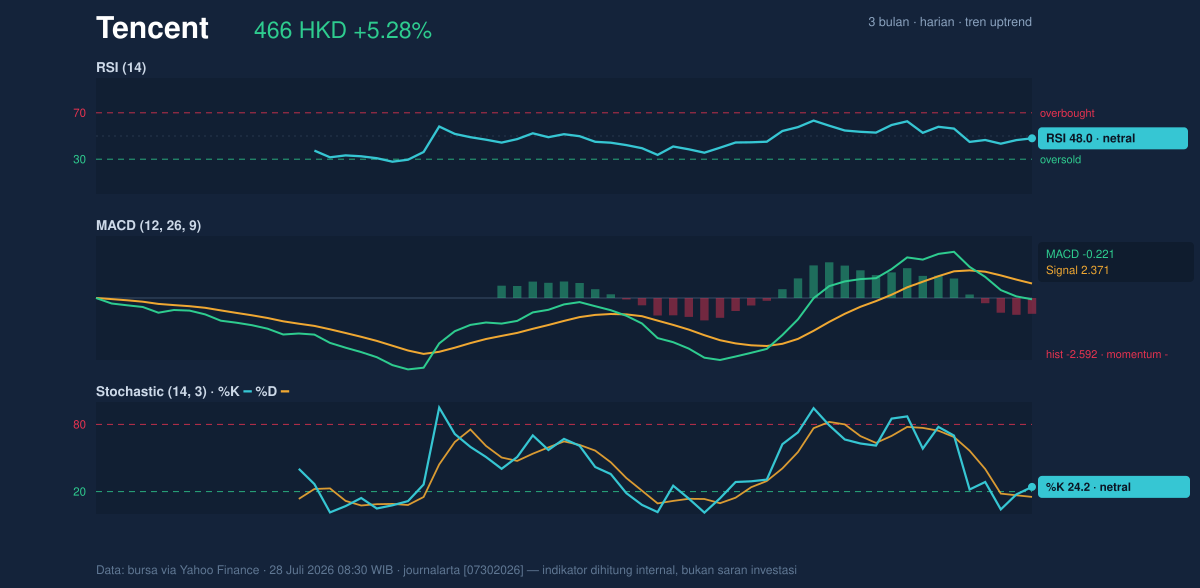
The momentum picture is more mixed than the trend picture. RSI at 48.0 is neutral, which tells us the stock is not overbought and not oversold; it is simply in the middle of the field. That matters because it leaves room for movement in either direction, rather than warning that the rally is already stretched.
The Stochastic %K at 24.2 and %D at 15.3 also sit in neutral territory, but they are low enough to suggest the stock has recently cooled off from stronger levels. In plain language, that often means the market has paused rather than broken down. The more cautionary signal comes from MACD at -0.221, with the signal line at 2.371 and the histogram at -2.592. That negative spread shows near-term momentum is still lagging price, so the rally has not yet earned full confirmation from the trend-following oscillator.
That mismatch is the key signal. Price is ahead of momentum, not the other way around.
Volatility & Volume
Bollinger Bands show Tencent trading in a relatively orderly structure, with the middle band at 455.44, upper band at 489.28, and lower band at 421.60. The %B at 66% says the price is in the upper portion of the band but not pressing against the top edge. The 14.9% band width is described as normal, which suggests the stock is not in a volatility squeeze that often precedes a sharp breakout, nor in a panic expansion that would imply disorderly trading.
The more notable volatility marker is the ATR(14) at 17.51, equal to 3.8% of price. That is a high-volatility reading, meaning Tencent can still move quickly even when the chart looks calm. For readers, ATR is the average size of recent daily movement; a higher reading means wider swings are more likely, and stop levels need to respect that.
Volume, however, is the soft spot in the current setup. The latest print of 18,143,997 shares is well below the 20-hour average of 35,030,647, or about 0.5× average turnover. That says the latest advance was not backed by broad participation. At the same time, OBV is rising, which is a constructive divergence: on balance, volume flow has still been accumulating even if the most recent session was quiet. That combination often points to a market that is being supported, but not yet with conviction strong enough to call the move fully confirmed.
Key Levels & Scenarios
The first support to watch is 455.44, the SMA20 and Bollinger midline, because a loss of that level would weaken the immediate trend structure. Below that, 429.80 is the key 20-hour support and the more meaningful line in the sand for the current range. On the upside, 484.00 is the first resistance to clear, with 489.28 — the upper Bollinger Band — acting as the next technical barrier before the stock can challenge the 494.80 3-month high.
If Tencent holds above 455.44 and volume starts to improve, the chart leaves room for an approach toward 484.00 and possibly 489.28. If it fails to hold 429.80, the recent breakout-like tone would weaken and the stock would be exposed to a deeper reset toward the lower end of the range.
Technical Verdict: HOLD (wait & see)
HOLD (wait & see) fits best here because the trend is positive, but momentum and participation are not yet fully aligned.
- Golden cross and price above both SMA20 at 455.44 and SMA50 at 448.81 support the broader bullish structure.
- MACD remains negative, which means the latest price strength is not yet fully confirmed by momentum.
- Volume is only 0.5× average, so the move lacks strong participation even though OBV is rising.
Verdict invalidated if price breaks below 429.80.
- Ideal Entry Range: 455.44 to 429.80
- Exit Target: 484.00 to 489.28
- Stop Loss protection: below 429.80
For non-traders, this means Tencent’s chart is still leaning upward, but the market is asking for more proof before the move can be trusted.
“The trend is alive, but the market has not yet paid full conviction for it.”
Summary Data Tencent
| Last price | 466.40 HKD |
| Change 1 day / 5 days / 1 month | 5.28% / -1.60% / 10.99% |
| Trend / MA-cross | uptrend / golden |
| SMA20 / SMA50 | 455.44 / 448.81 |
| RSI (14) / Stochastic %K | 48.0 / 24.2 |
| Bollinger %B / ATR | 66% / 17.51 |
| Support / Resistance 20 days | 429.80 / 484.00 |
| Data as of | 28 Juli 2026 08:30 WIB |



