UOB Stock Technicals Today: Gains 0.90%, Momentum Weakens
On Juli 30, 2026: price 43.89 SGD, trend uptrend, RSI 60.4, support 39.65, resistance 44.95. technical analysis of uob stock. UOB Stock Technicals — full…

United Overseas Bank (UOB) traded at SGD 43.89 on SGX in Singapore, extending a measured uptrend as the share price stayed above its short- and medium-term moving averages. The move was modest — 0.90% on the day and 10.39% over one month — but the chart, as shown in the price action section below, suggests the stock is still working higher within a relatively mature range rather than breaking into a fresh acceleration phase.
Trend & Price Action
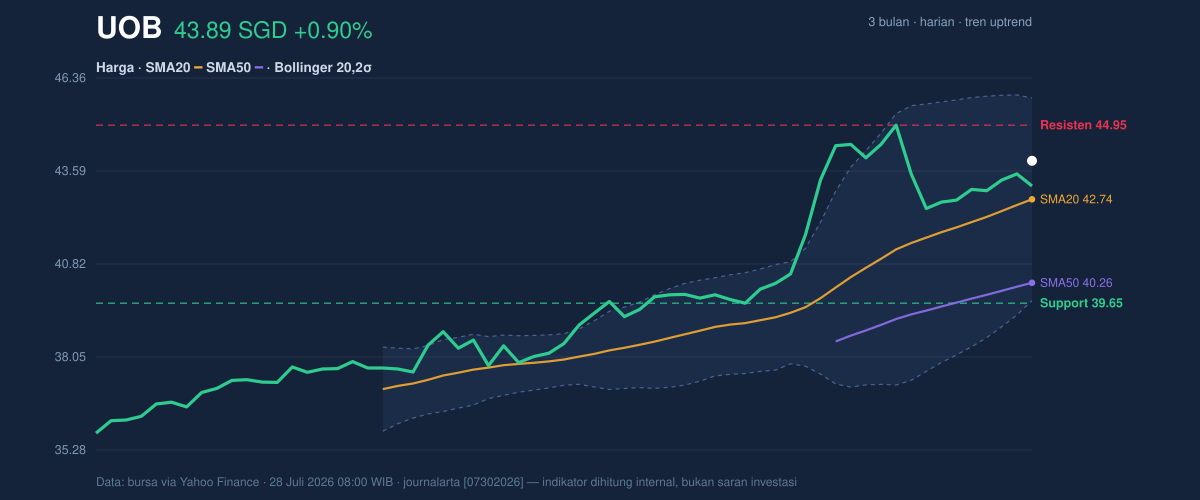
UOB remains in an uptrend, helped by the fact that price is holding above the SMA20 at SGD 42.74 and well above the SMA50 at SGD 40.26. That matters because the shorter average sitting above the longer one usually signals that recent buying has been strong enough to keep the intermediate trend intact. There is no fresh MA-cross, so this is not a new trend ignition story; it is more a case of an existing advance still being respected.
The share price is also sitting near the upper half of its recent trading band, with SGD 43.89 positioned at about 80% of the 20-hour range. That placement is important because it shows buyers have enough control to keep the stock closer to resistance than support, but not so much control that the move looks stretched beyond the current range. The 3-month high at SGD 45.15 is close enough to matter, while the 3-month low at SGD 35.74 shows how far the recovery has already come.
Oscillators & Momentum
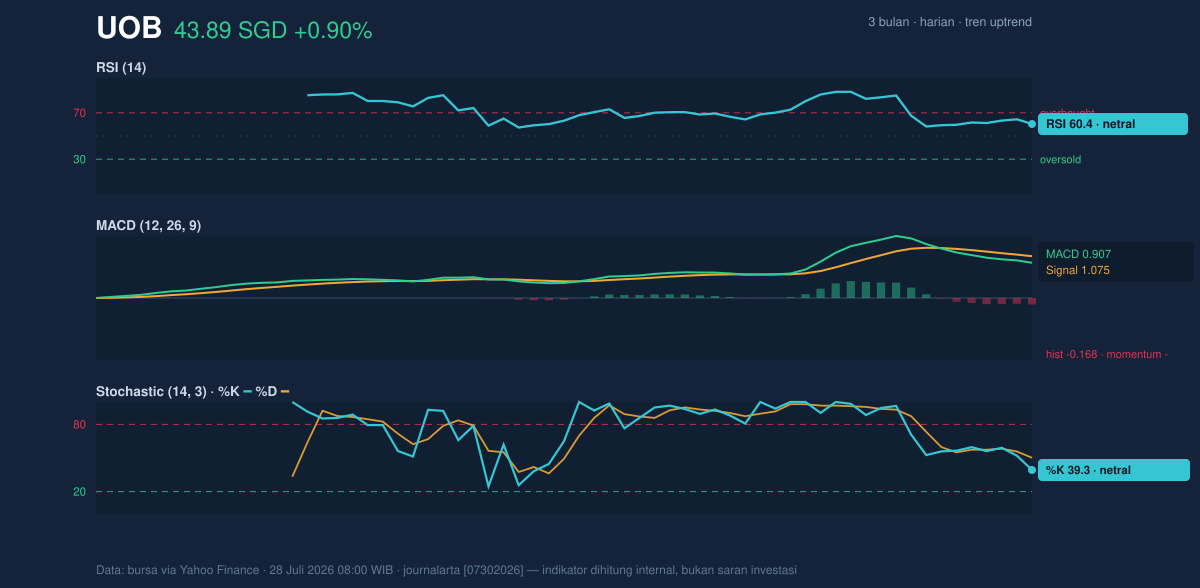
The momentum picture is more restrained than the trend picture. RSI at 60.4 is still neutral rather than overbought, which means the stock has room to extend without immediately flashing a classic exhaustion warning. Stochastic %K at 39.3 and %D at 50.2 also sit in neutral territory, suggesting the recent rise has not yet turned into a fully heated short-term surge.
The catch is the MACD at 0.907 versus signal at 1.075, with a histogram of -0.168. In plain language, that means the trend is still positive, but the pace of upside momentum has softened relative to the signal line. This is not a bearish reversal by itself; it is more of a warning that the stock may need consolidation or a fresh catalyst to push cleanly through nearby resistance. When momentum lags price, rallies can continue, but they often do so in a slower, step-by-step fashion rather than in a straight line.
Volatility & Volume
The Bollinger setup is telling because it shows UOB trading at %B of 69%, which places the shares above the middle band but below the upper band at SGD 45.76. That usually indicates constructive positioning: the stock is not pressing the ceiling, yet it is clearly not languishing near the lower band at SGD 39.73. The 14.1% band width is described as normal, so this is not a squeeze waiting for a violent breakout, nor an expansion phase that would imply unusually broad swings.
Volume adds a note of caution. The latest turnover of 3,022,532 was only 0.9x the 20-hour average of 3,534,738, which means the advance is not being backed by exceptional participation. That does not negate the move, especially with OBV rising, but it does suggest buyers are accumulating without urgency rather than piling in aggressively. In technical terms, rising OBV with lighter-than-average volume can still support an uptrend, but it also hints that follow-through may depend on whether the stock can attract more participation near resistance.
Key Levels & Scenarios
The nearest support sits at SGD 39.65, while resistance is marked at SGD 44.95. Those levels frame the current debate: whether UOB can keep inching toward the top of the range, or whether it stalls before testing the 3-month high at SGD 45.15. Because the price is already near the upper end of the recent band, the market is effectively asking whether buyers still have enough strength to absorb supply overhead.
If UOB clears SGD 44.95 and holds above it, the next technical test would be the upper Bollinger band at SGD 45.76, with the 3-month high at SGD 45.15 acting as an intermediate checkpoint. If it fails to hold the current trend area and slips back through SGD 42.74, the stock would be losing the Bollinger midline and the 20-day average, which often shifts the tone from constructive to neutral. A deeper break below SGD 39.65 would place the trend under more serious pressure because it would give back the recent range floor.
Technical Verdict: HOLD (wait & see)
HOLD (wait & see)
- Trend is still positive: price remains above both SMA20 at SGD 42.74 and SMA50 at SGD 40.26, so the broader structure has not broken.
- Momentum is mixed: RSI 60.4 and Stochastic 39.3 / 50.2 are neutral, but the MACD histogram at -0.168 shows momentum has faded relative to the signal line.
- Participation is not strong enough to confirm a breakout: volume is 0.9x average even though OBV is rising, which supports the trend but does not yet validate an energetic push through resistance.
Verdict invalidated if price breaks below SGD 39.65.
- Ideal Entry Range: SGD 42.74 to SGD 43.50
- Exit Target: SGD 44.95 to SGD 45.76
- Stop Loss protection: below SGD 39.65
In plain English: UOB still looks technically healthy, but it is moving in a way that suggests patience is more useful than urgency until the next push through resistance or a loss of support. The next scheduled technical test is the attempt on SGD 44.95, with the 3-month high at SGD 45.15 just above it.
Summary Data UOB
| Last price | 43.89 SGD |
| Change 1 day / 5 days / 1 month | 0.90% / 2.74% / 10.39% |
| Trend / MA-cross | uptrend / none |
| SMA20 / SMA50 | 42.74 / 40.26 |
| RSI (14) / Stochastic %K | 60.4 / 39.3 |
| Bollinger %B / ATR | 69% / 0.91 |
| Support / Resistance 20 days | 39.65 / 44.95 |
| Data as of | 28 Juli 2026 08:00 WIB |



