AstraZeneca Stock Drops 0.69% Today, Momentum Gains
On Agustus 3, 2026: price 12,632.00 GBp, trend downtrend, RSI 41.4, support 12,364.00, resistance 14,364.00. technical analysis of astrazeneca stock.

London-listed AstraZeneca slipped to 12,632.00 GBp on Thursday, according to Yahoo Finance data via the LSE, extending a month-long pullback that has left the shares 12.62% lower over 1 month and still trading below the 20-day SMA at 12,945.00. The stock is not in freefall, but the chart is sending a clear message: sellers still control the medium-term trend, while short-term momentum is trying to stabilise without yet proving it can reverse the broader slide.
Trend & Price Action
The most important signal is structural. AstraZeneca remains in a downtrend, with the SMA20 slope at -2.61% over 5 days, which means the short-term trend line is still pointing lower rather than flattening out. Price sitting below the SMA20 and well under the SMA50 at 13,405.96 tells readers that the shares are trading beneath both the near-term and intermediate trend gauges, a classic sign that rallies are being sold into rather than embraced.
There is no fresh moving-average crossover to lean on, so the chart lacks the cleaner bullish signal that would usually suggest trend repair. As shown in the chart below, the price is also positioned in the lower half of its recent band structure, with the stock sitting roughly 13% of the way up the 20-hour range between 12,364.00 support and 14,364.00 resistance. That placement matters: it shows the market is closer to the lower boundary than the upper one, but not yet at an obvious capitulation point.
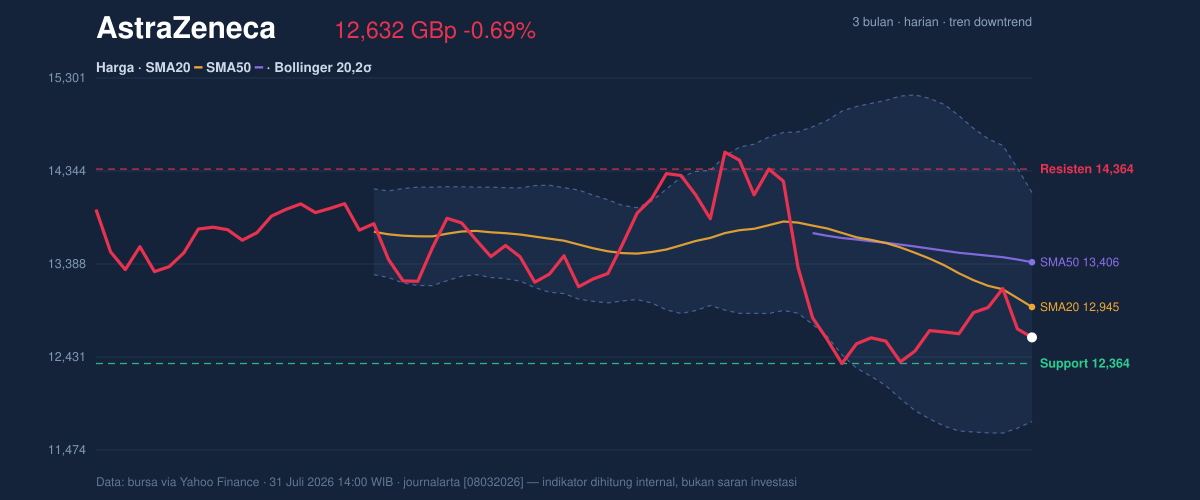
The broader three-month range adds context. AstraZeneca is trading far below the 3-month high of 15,126.00, but still comfortably above the 3-month low of 9,892.00. That is not a panic chart. It is, instead, a market in retreat that has not yet reached the kind of washed-out level that often precedes a stronger rebound.
Oscillators & Momentum
Momentum is mixed, and that mix is why the picture is more nuanced than the downtrend alone suggests. The RSI at 41.4 is neutral, which means the share price is not oversold enough to argue for exhaustion, but also not overbought enough to imply the recent decline has room to accelerate purely on momentum grounds. In plain language, the market is neither stretched nor repaired.
By contrast, the Stochastic oscillator is overbought, with %K at 83.7 and %D at 87.4. That sounds counterintuitive in a falling stock, but it often means the latest bounce has moved faster than the trend can justify. In other words, the stock may have rallied enough in the very short term to look crowded, even though the larger trend remains weak. As shown in the momentum chart, that makes the current rebound vulnerable if buyers fail to extend it quickly.
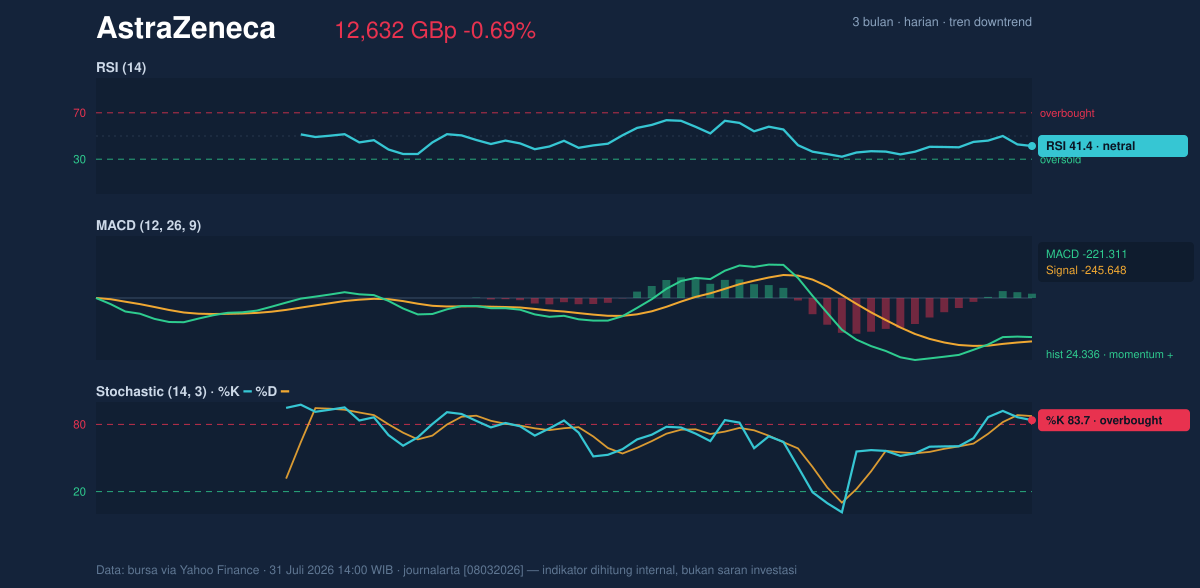
The MACD remains negative at -221.311, but the histogram is positive at 24.336 and the signal line is -245.648. That combination is important. A negative MACD still says the trend has not turned positive, yet a positive histogram shows the gap between MACD and signal is narrowing in the right direction. For non-specialists, this is often read as improving momentum inside a still-bearish framework. It is a repair signal, not a reversal signal.
Volatility & Volume
Volatility is elevated. The ATR(14) at 643.37, equal to 5.1% of price, means AstraZeneca is capable of making relatively wide daily moves. That matters because it raises the odds that support or resistance can be tested quickly once the market commits to a direction. The Bollinger Bands reinforce that message. With the middle band at 12,945.00, the upper band at 14,122.63, and the lower band at 11,767.37, the stock is trading below the centre of its volatility envelope but not near the lower edge.
The %B reading of 37% shows price is leaning toward the lower half of the band range, which is consistent with weakness but not a full breakdown. The 18.2% Bollinger width is described as normal, so the stock is not in a squeeze that would usually precede a sharp volatility expansion from compression. Instead, the market already has enough movement in it, and the next break is more likely to be driven by price acceptance above resistance or rejection at support.
Volume adds one subtle positive. Last trade volume was 1,904,551, below the 20-hour average of 2,928,409, or 0.7× normal. That tells us the latest move did not come with strong participation, which weakens the conviction behind the selling. The OBV is rising, however, and that suggests money flow is improving even as price remains under pressure. Rising OBV while price lags often hints that accumulation is starting quietly, but it needs confirmation from the tape.
Key Levels & Scenarios
For now, the market is boxed in by clearly defined levels. The nearest support sits at 12,364.00, while resistance stands at 14,364.00. A move back above the SMA20 at 12,945.00 would be an early sign that sellers are losing control of the short-term trend, but the more meaningful test is whether the shares can reclaim the band centre and then push toward the upper Bollinger line at 14,122.63. Failure to hold 12,364.00 would expose the stock to a deeper retracement toward the lower Bollinger band at 11,767.37.
Because the shares are still below both major moving averages, any rally needs follow-through rather than just a one-day bounce. The chart would improve materially if the price can close back above the SMA20 with momentum confirmation from the oscillators. Until then, the stock remains in a recovery attempt rather than a confirmed trend change.
Technical Verdict: HOLD (wait & see)
- Reason 1: The downtrend is still intact, with price below the SMA20 and SMA50.
- Reason 2: The MACD histogram is positive, showing momentum is improving even though the MACD remains negative.
- Reason 3: The Stochastic is overbought while volume is only 0.7× normal, which makes the rebound look fragile.
- Invalidation: This verdict is invalidated if price falls below 12,364.00.
- Ideal Entry Range: 12,364.00 to 12,945.00
- Exit Target: 14,122.63 to 14,364.00
- Stop Loss Protection: below 11,767.37
In plain English: AstraZeneca is still weak, but the chart is showing early signs that the selling may be losing force.
3-month low: 9,892.00.
Summary Data AstraZeneca
| Last price | 12,632.00 GBp |
| Change 1 day / 5 days / 1 month | -0.69% / -0.30% / -12.62% |
| Trend / MA-cross | downtrend / none |
| SMA20 / SMA50 | 12,945.00 / 13,405.96 |
| RSI (14) / Stochastic %K | 41.4 / 83.7 |
| Bollinger %B / ATR | 37% / 643.37 |
| Support / Resistance 20 days | 12,364.00 / 14,364.00 |
| Data as of | 31 Juli 2026 14:00 WIB |


